I needed an excuse to make one of these animated bar charts, so here you go. The top US states for competitive pinball across the 2010’s.
Edit: improved animation below
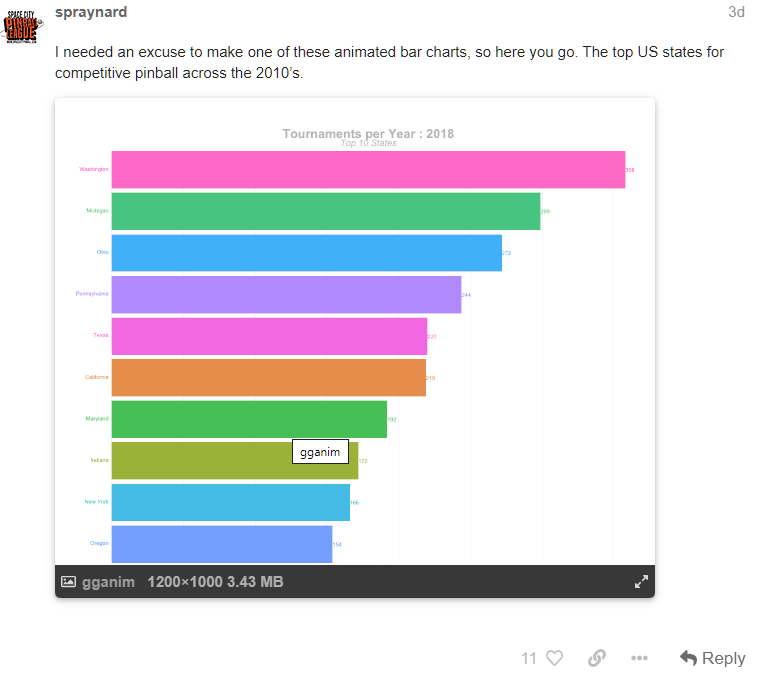
I needed an excuse to make one of these animated bar charts, so here you go. The top US states for competitive pinball across the 2010’s.
Edit: improved animation below
Fuck. This is great.
Be even bettter if one could read the graph.
I could read it.
The 2019 data isn’t accurate, NC shows 143 in 2019 but we had 185. Maybe its off a year or something…
If you then break the top 10 down from total tournaments to the population of each state then the most competitive states are the following.
It would be better if the X axis did not change.
Changing too fast? font too small? can’t distinguish colors? too small on mobile? I’d love to improve it, but you need to be more specific, thanks.
thanks i’ll check it out. the way i have to get the state data from the api is a bit cumbersome (basically have to query the ifpa database for every single tournament). It times out a lot and sometimes the data is incomplete.
Delaware should be #10.
Based on what?
Just cause, lol.
Fair enough. KY should be #1 then.
And California should be way above 10 because people here have too many other things to do.
Here is how it looks on PC. Font for text/numbers way to small. On a phone/tablet at least its easy to zoom up to see the states and details.
Fun graph? Have an upvote!
I agree that the axis and the labels should increase in size to make them more readable.
I would also slow the rate of change down to maybe 0.5x of what it is currently.
What tool are you using for this? How difficult would be be to include a cumulative total of tournaments (which would show growth over time) as opposed to a strict view of a year at a time?
Or, if you have the data down to individual tournaments at a Date level, could you do something like a “Rolling 12 Months Cumulative”
Do you happen to have Provincial level data?
Good stuff, thanks for sharing.
Thanks, I’ll tinker around when i get some time.
I made this using R (ggplot and gganimate packages).
Cumulative totals are doable, though I think that will result in less “action” over time (in terms of states trading rankings).
Thought about doing the animations at the month level too. That would make more sense with cumulative data, otherwise states would be switching around constantly.
Yes I have Provincial level data.
We have way more pins on location than all the others, which is even better IMO. d;^p
True story: SF has more pins per square mile than Portland.
Can the names of the states be put in the bars themselves?
But not per capita (I don’t think)