The changing relationship between points and ranking

I was doing some archival digging of the IFPA website on archive.org today, and I noticed something interesting in my results.

November 2018: Ranked 607th with 143.07 points
Today: Ranked 712th with 145.79 points

I gained 2.72 points, and yet my ranking dropped 105 places.

I’m pretty curious about this phenomenon. Is it a matter of the “meaty middle” gaining more ground on me than I can make up myself? If it the increased access to more and more large point events, and the increase in people’s willingness to travel to them?

Also how widespread is this phenomenon? Maybe @coreyhulse can make a graph mapping people’s relative points:ranking over time and figuring out where the tipping point is for points gain to actually mean ranking gain?

Discuss!

2 Likes

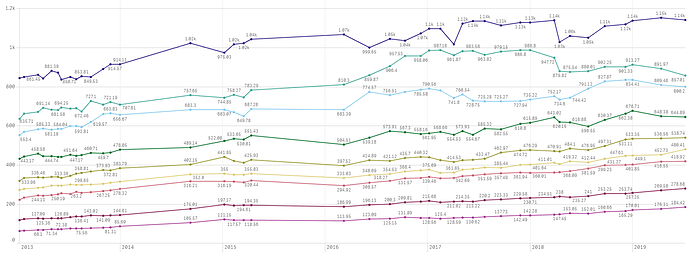
I’ve been tracking this for years, and it’s a simple matter or more events plus more people per event means you need more points each year for a given rank. It’s a bit less inflationary at the top end than further down, as you’ll see. If also bounces around a lot right after a major event. Here’s a sampling:

WPPR Points by Ranking Position
2015 and after is WPPR 5
Date 1 5 10 25 50 75 100 250 500
1/7/2013 843.38 635.71 553.40 431.16 318.31 271.95 222.49 118.73 62.28
1/23/2013 850.63 662.85 569.22 443.17 333.96 276.99 232.48 122.99 64.48
3/14/2013 861.45 670.96 582.70 458.58 336.46 283.91 244.13 127.09 68.10
4/1/2013 843.27 691.14 585.33 445.80 334.50 284.34 242.40 125.36 67.98
5/1/2013 881.39 682.27 581.18 444.74 338.73 293.71 246.39 126.68 71.34
5/24/2013 871.82 681.58 584.83 441.70 338.71 295.23 250.19 127.69 72.38
6/5/2013 836.58 694.25 584.04 441.79 333.36 295.22 254.55 126.89 72.38
7/7/2013 850.71 687.92 599.06 451.64 343.71 300.10 252.35 132.01 74.73
7/28/2013 839.57 690.44 599.61 447.17 356.45 298.66 263.20 136.41 76.09
8/16/2013 853.81 672.46 592.81 450.17 358.81 298.65 257.29 136.41 75.56
9/18/2013 849.53 727.10 619.57 460.71 367.19 300.39 260.29 143.02 77.17
11/1/2013 890.13 708.79 659.86 459.70 373.93 304.45 267.25 141.09 78.63
11/27/2013 914.57 721.19 663.83 463.69 372.81 309.30 269.96 142.40 81.31
12/31/2013 914.11 707.81 656.67 478.05 383.79 315.14 278.32 144.61 85.69
9/8/2014 1,023.38 757.65 683.30 489.14 402.15 352.80 316.21 175.01 105.57
1/7/2015 975.03 744.85 683.07 522.08 441.85 355.00 316.19 197.37 121.15
2/10/2015 1,016.15 758.27 670.09 533.65 420.98 350.67 314.74 192.04 117.57
3/17/2015 1,022.92 745.12 649.78 530.81 412.21 349.39 311.36 194.61 117.09
4/13/2015 1,043.03 783.29 687.28 551.43 425.93 355.83 320.44 194.35 118.56
3/8/2016 1,067.04 810.30 683.39 504.51 397.52 333.03 294.92 186.99 113.95
6/7/2016 999.65 859.87 774.57 539.18 424.89 348.69 308.57 196.13 123.09
8/19/2016 1,045.51 906.40 756.51 573.91 421.12 354.53 318.27 200.30 125.15
10/12/2016 1,035.05 957.53 773.93 567.30 435.70 366.40 331.57 209.81 131.89
12/7/2016 1,073.09 958.06 785.58 558.16 440.32 372.12 333.37 213.15 129.64
1/6/2017 1,097.10 985.51 790.56 561.95 438.75 375.69 339.46 215.68 128.56
2/15/2017 1,097.10 987.16 780.78 568.66 424.92 359.69 330.83 208.68 125.40
4/4/2017 1,017.71 961.87 741.80 554.53 414.53 361.85 332.85 212.02 128.59
5/5/2017 1,122.32 982.14 760.54 573.93 424.00 376.31 342.69 214.35 130.45
6/11/2017 1,136.22 983.58 728.75 554.67 425.86 379.52 346.93 213.22 130.62
7/23/2017 1,136.28 963.82 725.28 585.32 432.47 386.55 351.59 220.20 133.84
9/19/2017 1,113.48 979.15 725.27 582.55 462.97 385.44 357.49 223.33 137.73
11/27/2017 1,127.62 986.80 727.94 610.80 474.72 400.07 361.94 229.58 142.49
1/1/2018 1,127.62 986.80 735.22 615.89 476.29 401.64 360.01 230.71 142.28
3/28/2018 1,139.10 947.72 752.17 643.02 470.91 411.01 361.12 234.51 145.53
4/16/2018 1,027.66 879.82 734.60 620.15 469.54 404.02 362.96 238.00 147.45
5/23/2018 1,060.21 875.54 744.42 616.88 484.10 419.32 368.09 235.27 153.05
7/27/2018 1,050.91 880.01 791.12 596.55 476.95 412.44 381.59 241.00 152.01
9/24/2018 1,110.31 902.25 827.87 630.37 497.31 431.27 399.23 253.25 160.66
12/7/2018 1,119.65 901.33 834.42 662.38 531.11 447.61 400.05 253.74 165.29
1/1/2019 1,137.71 913.27 834.41 676.71 533.35 449.10 401.85 257.25 170.01
4/13/2019 1,153.02 891.97 809.46 648.38 536.56 452.73 416.55 269.58 176.31
7/8/2019 1,142.02 857.01 800.20 644.89 538.74 480.41 418.92 278.68 184.42

My sampling points have been random at times; I try to always do a year-end capture, though.

8 Likes

I have noticed this as well. I’m used to hovering between high 100’s to high 200’s. Today I am ranked 307th. I live in an area (Alabama) that runs a relatively small # of tournaments, although we are on a pace this year to nearly double our # of tourneys from 2018. I chalk it up to the proliferation of tourney “hot bed” areas. As tourneys in those areas have more and more participation, the average ranking of the player base goes up, adding to the potential points of every event. So it has a snowball effect.

I do think it is great for pinball though and I see it as a good thing.

This made me look up some old screenshots I’d taken as I was goal setting around getting into the women’s championship. In June, 2017, 118.61 was the target to reach 16th among women players. Current 16th position is nearly 50 points higher now at 168.28!

2 Likes

I should have known @BMU would already have a spreadsheet :slight_smile:

So it seems like around 50th where things appear to start evening out, to the point that at the upper echelons the cutoff point for a place actually goes down at times rather than up, which makes sense given the significance of the gap between the 1% and everyone else. You can really see the effect in the last three years or so though, it is obvious that efforts like circuit and state championships have really helped to spur growth.

Also to be clear I’m not “upset” about this, but it is really interesting. One of the things that has spurred growth has been accessibility to points and seeing your ranking grow. If it is increasingly necessary to travel for that to happen, then does that mean we can expect to see growth taper off at the lower levels as people peak out more easily? I know that locally states has helped to keep that from happening, which is great, but even that can be problematic in a large community. I mean, you look at that chart and it seems we don’t have anything to worry about yet, but I’m guessing that at some point in the future the “points gap” will start to become more of an issue.

Interesting stuff for sure.

8 Likes

After re-reading your initial post it was surprising that your rank slipped that much in such a short time while improving your point total. At first glance I would’ve thought that would be over at least a year’s time.

@bmu has obviously done the hard work by tracking all the relevant data points.

I threw it on a quick graph to show the trending over time.

Big drops for top players around the time of the PAPA reset as those points fall off the scale and no other points there to replace them.

Once we get past Pinburgh I might have time to play around with the API to see if there’s anything that can be created to be more dynamic. I know @Richthofen has some cool graphs in the IFPA app that show your rank over time, so the data must exist that tells you point-in time at least your position, and hopefully perhaps the number of points you had at that time.

2 Likes

Just did a check on my own: current rank 46th with 569.92 points. When we first switched to WPPR 5, that would have been 21st.

I think there is also the factor of pinball popularity creating an increase in all WPPRs. Since the average local tournament isn’t at 64 players, any new (IFPA eligible) players that join the ranks are also chipping in their extra 0.5 to the WPPR pool - and that adds up quickly!

2 Likes

iirc there have been a lot of wppr changes over the years, i.e. tracking best 15 events and now best 20. Is that data normalized for those situations?

2 Likes

The switch to 20 events with WPPR5 was pretty close to a wash; I remember discussing it with Josh at the time. He may have an exact before / after somewhere; here’s the closest I have:

Date 1 5 10 25 50 75 100 250 500
Last WPPR 4 976.61 744.87 683.05 522.08 441.85 356.39 317.58 196.46 121.14
2/10/2015 1,016.15 758.27 670.09 533.65 420.98 350.67 314.74 192.04 117.57

I remember the “target” being around 1000 WPPR’s for World Rank #1 with our simulations.

Once we switched to WPPR v5.0 at the start of the 2015 season, the biggest change to events pre-2015 was no longer being able to combo the “Main + Side” tournaments together for one listing on your top 15 resume.

When we split those out, our only answer to normalization was increasing the number of results that counted on your resume. I remember running simulations at 30 events and 25 events. We ultimately settled at 20 events providing the best results to kick off v5.0.

Re-reading through all the old emails (many from Mr. Matthews) on the trials and tribulations of getting v5.0 ready to go primetime makes me extremely thankful that we haven’t had to do another massive re-write since then for v6.0 :slight_smile:

1 Like

So I have my own philosophy on the concept - and the way that I gauge overall point inflation/disparity is by considering the following:

There are 3 types of tournament pinball players, those being local only, regional, and traveling.

Local only are a majority of players and start within a city/ county, etc. The only time they participate in a circuit tournament is if it is within driving distance and convenient.

Regional are players who are willing to travel marginal distances and occasional play in multi day tournaments. They may drive 4+ hours or get on a short flight. They also play locally.

Travelers have access to enough resources it enough commitment to venture to circuit events on a rather consistent basis. They play in everything within driving distance and also participate locally when desired.

Each one of these players has access to a certain number of tournaments, and in turn a certain amount of WPPR points - this point value is what I call the Maximum Point Value (MPV) - and this caps out differently based on A) the type of player you are and B) Where you live.

To calculate MPV is rather simple, figure out the highest tournament value that you can obtain regularly and multipliers that by how many tournaments count towards your IFPA Ranking. Then look up that point value on the current standings (or on a resource like @BMU above) to see your Maximum Achievable Rank (MAR).

This is easiest to calculate for local players, as other players would need to estimate what they can regularly obtain based on the tournament they choose to participate it.

For example - Person A lives in San Diego, CA, the average tournament in that area is 10 wppr’s. Person A’ MPV is 10 * 20 = 200. Looking at the current world standings 200 points would put you in 442nd place - therefore person A’s MAR is 442.

Let’s say Person B lives in Myrtle Beach, SC - there the average tournament has fewer people and average 4 WWPR points per tournament. MPV is 4 * 20 = 80 and MAR = 1,383. (1,383rd rank).

For regional and traveling players you would access your ability and guess where you would place in a ‘larger’ tournament - add that value minus your local average - and check the rank.

For example, going back to Person A, I am going to INDISC and I estimate that I can place around 24th in that tournament - this would get me 12 points, which would replace one of my estimated 10s. I would then gain 2 points (12-10) on my overall MPV = (10 * 20) + 2 = 202 - and my MAR becomes 432, which is 10 positions better than being local only.

Hope this all makes sense, you could easily graph out an estimate of local average tournament points and see how it impacts over all rank. Ultimately quantity of tornados helps to an extent, and mostly for local only players, after that it becomes a combination of how large the regional tournaments are around you and how willing you are too travel to find bigger tournaments.
This is how I view WPPRs.

6 Likes

I get what you are driving at that there is a strong correlation between location and tourney average available.

However I would say you need to adjust the likely WPPRs using another statistic, such as a player’s effy percentage. For example, if a player has an effy of 30%, and there are 200 points available, then they would on average earn about 60 of those points. (I know the effy statistic is not exact).

If a person (using the player in San Diego example) is able to earn that MPV of 10*20 = 200, then that means they won every one of those events. (I read it as the average is 10 points for the win, not what the average WPPR point value is for all players participating).

It is highly doubtful that a person that is capable of winning 20 events worth 10 WPPR points has only a 442 ranking-that person probably travels to some of the area events, maybe even out of state and can earn some decent points at a larger event.

Anyway, fun stuff to mess around with. :slight_smile:

Absolutely, that’s why I was calling it Maximum! Not probable… :blush: I get questions all the time about ranks/points/etc. And I hear a lot of people complain that they can’t obtain a good rank without tons of travel - or that you can buy your way into the top 250 - I simply counter saying you could get as high as 400th if you won 20 events, so the real prohibitor is not really travel/money.

This clearly becomes more difficult if your region only runs one tournament a month, though.

If you are ranked in the top 250 you have some above average skill - but not being ranked in the top 250 doesn’t mean the contrary that you are a bad player.

1 Like

It’s tempting to suggest that it’s cheaper to get WPPR’s on the west coast (more tournaments, cheap flights/ drives between cities), but the high cost of living more than balances out the value. If you don’t mind being homeless, come west for cheap points,

Pittsburgh is probably the best place to get WWPR’s as cheap as possible (and still be able to pay the rent). May be a spot or two overseas also.

1 Like

I would wager Cleveland is a close second.

3 Likes

By that measure our Oklahoma/Kansas players have an advantage.

2 Likes

That’s why I’ve been over ranked for years! And now that Columbus has picked up, Ohio is very WPPR rich. Plus we’re only 2 hours from Pittsburgh for all the big stuff.

1 Like

3 Likes