Strikes Tournament Simulation Results

The following information may be useful to those planning to run a tournament.

Introduction:

Strikes-based tournaments were simulated to determine the number of rounds required to finish a tournament. This was done using a Monte Carlo simulation method, meaning some simulation inputs were randomized for a large number of simulations, then statistics were calculated using the results. Some tournament inputs are within the power of the TD to control (number of entrants, number of strikes), while others are not (how well each player plays that day), hence the Monte Carlo approach.

Player Model:

Players are assigned a base skill level chosen from a log-normal distribution whose first parameter is 0 and whose second parameter is 0.25. There is nothing special about this distribution; it’s an arbitrary choice.

The distribution of base skill levels looks like this:


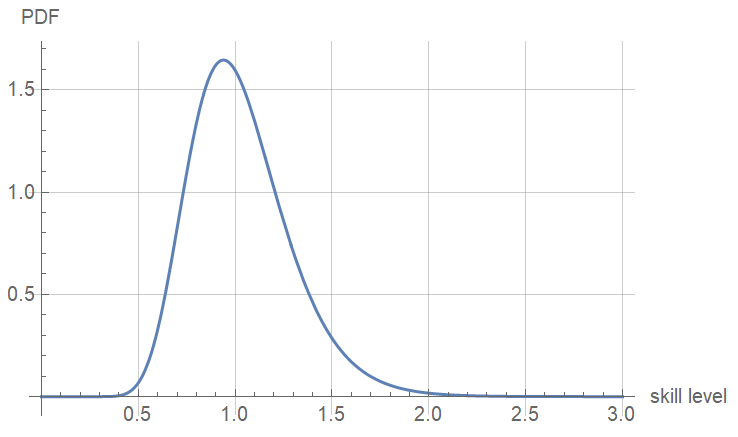
The majority of players have a skill level in-between 0.5 and 2.0, with 0.5 being a very poor player, and 2.0 being a highly-skilled player. The peak (or mode) of the distribution occurs at ~0.94, representing a player of moderate skill.

Game Score Model:

A player’s score on any particular game is modeled as a random variable chosen from another log-normal distribution whose first parameter is the player’s skill, and whose second parameter is 0.5. We want it to be possible for a good player to lose to a player of lower skill, but with diminishing probability as the skill levels grow further apart. The game score distribution for four players of different skill levels are shown below:


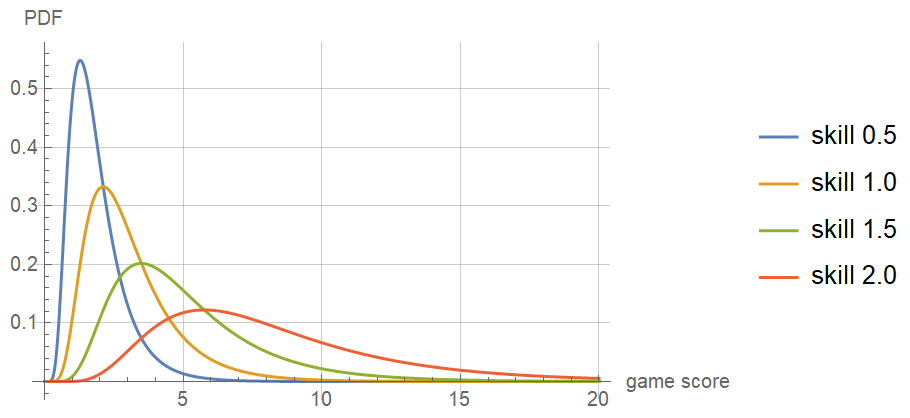
It is apparent that the 0.5-skill player’s game scores will have relatively little overlap with those of the 2.0-skill player, but the overlap is not zero - it’s not impossible for the low-skilled player to win, merely unlikely. To quantity how unlikely, consider the following pairings:

  • 0.5 skill vs. 1.0 skill: Higher skill player wins 76% of the time
  • 0.5 skill vs. 1.5 skill: Higher skill player wins 92% of the time
  • 0.5 skill vs. 2.0 skill: Higher skill player wins 98.3% of the time
  • 1.0 skill vs. 1.5 skill: Higher skill player wins 76% of the time
  • 1.0 skill vs. 2.0 skill: Higher skill player wins 92% of the time
  • 1.5 skill vs. 2.0 skill: Higher skill player wins 76% of the time

This seems reasonable for the results of a single game. The best players will almost (but not quite) certainly beat the worst players, but there’s a slim chance of an upset. This model does not need to be perfect to be useful.

Tournament Rules

Two types of strikes-based tournaments were analyzed: Fair Strikes and Progressive Strikes. After each game, the Fair Strikes system assigns strikes based on score ranking on that game, with 1st place receiving 0 strikes, 2nd & 3rd place each receiving 1 strike, and 4th place receiving 2 strikes. The full assignment is shown below:

  • 4 players per game: 0/1/1/2
  • 3 players per game: 0/1/2
  • 2 players per game: 0/2

The Progressive Strikes system also assigns strikes based on score ranking on the game, but with each player receiving a number of strikes equal to the number of players that beat them on that game.

  • 4 players per game: 0/1/2/3
  • 3 players per game: 0/1/2
  • 2 players per game: 0/1

In all simulations, the Swiss method is used to group players. After each round, the list of players still in the tournament is shuffled, then (stable-)sorted by number of strikes. Therefore, after Round 1, players with 0 strikes will tend to be grouped together, and players with 2 strikes will tend to be grouped together as well.

In all simulations, 4 players per game is the preferred arrangement. When the number of players still in the tournament is not divisible by 4, the groups are arranged to maximize the size of the smallest group. The partitioning is done such that the players with the fewest strikes end up in larger groups. Some examples:

  • 17 players are partitioned into 4 and 4 and 3 and 3 and 3
  • 16 players are partitioned into 4 and 4 and 4 and 4
  • 6 players are partitioned into 3 and 3
  • 5 players are partitioned into 3 and 2

Average Duration Statistics:

How long will the tournament last? In other words, how many rounds will be required for a winner to be selected? The answer depends on many things, including the number of entrants, the number of strikes required for a player to be eliminated, and the manner in which strikes are assigned.

In the following tables, each cell shows the average (mean) number of rounds required to conclude a tournament with a specific number of players (row labels) and a specific number of strikes (column labels). Due to limited computational power, only specific numbers of entrants were examined: 10, 12, 15, 18, 22, 27, 33, 39, 47, 56, 68, 82, and 100 players. This is sufficient to see the broad trends, but some details and squiggles in the curves are lost. Every number of strikes from 4 to 10 was simulated. Each combination of player count and number of strikes was given 5000 fully-simulated tournaments. The total is 910,000 tournaments simulated to generate the following statistics.

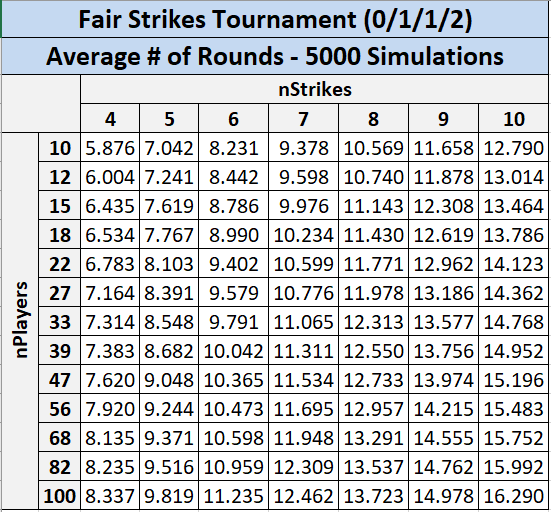
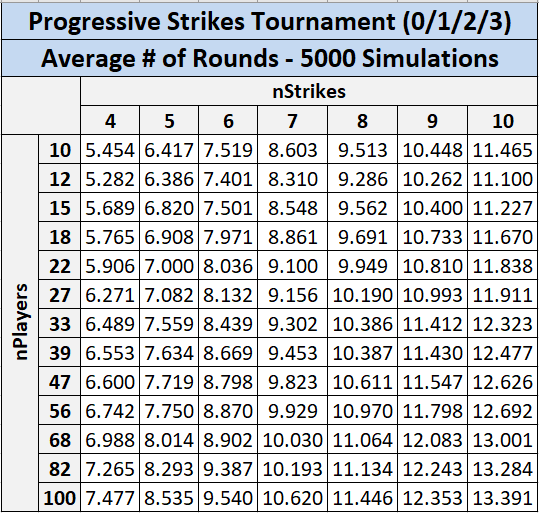
This same data is shown graphically below:

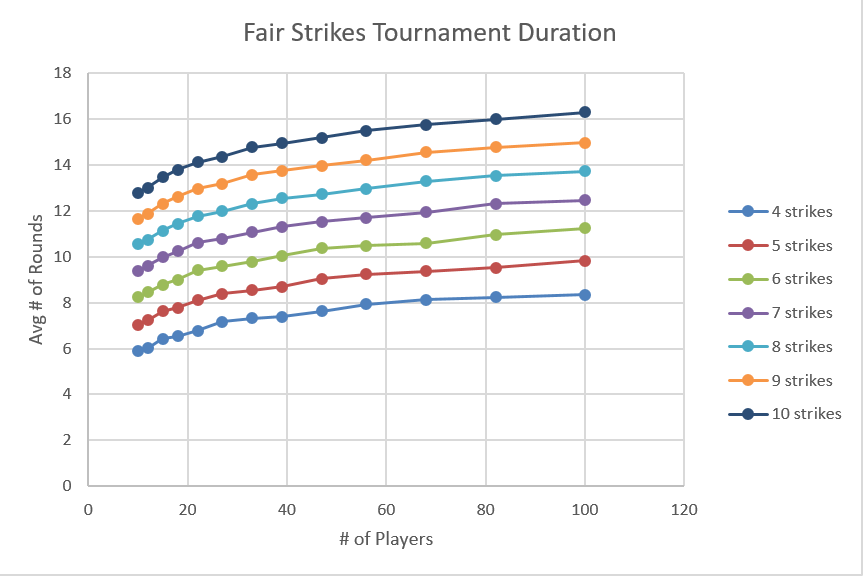
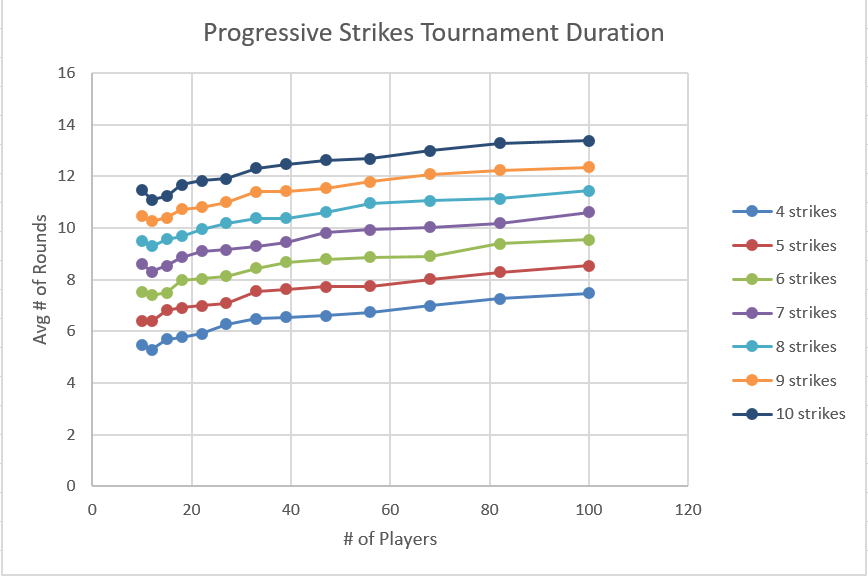
We can see that player count has a relatively weak effect on the duration of the tournament, while number of strikes must be chosen carefully, as it has a strong effect on duration.

Variance Deep Dive:

It’s also important to note that these are only average durations. Let’s now do a deep dive into a theoretical 47-player, 10-strike tournament to understand the variance.

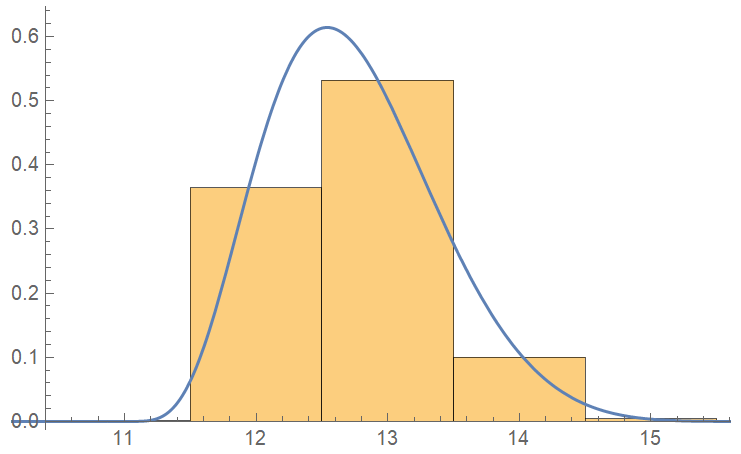
If the tournament is run with Progressive Strikes rules, we obtain a distribution of durations:

Average duration = ~12.5694 rounds

  • 10 rounds: 16 sims
  • 11 rounds: 1234 sims
  • 12 rounds: 1671 sims
  • 13 rounds: 995 sims
  • 14 rounds: 548 sims
  • 15 rounds: 297 sims
  • 16 rounds: 129 sims
  • 17 rounds: 64 sims
  • 18 rounds: 31 sims
  • 19 rounds: 12 sims
  • 20 rounds: 2 sims
  • 21 rounds: 1 sims

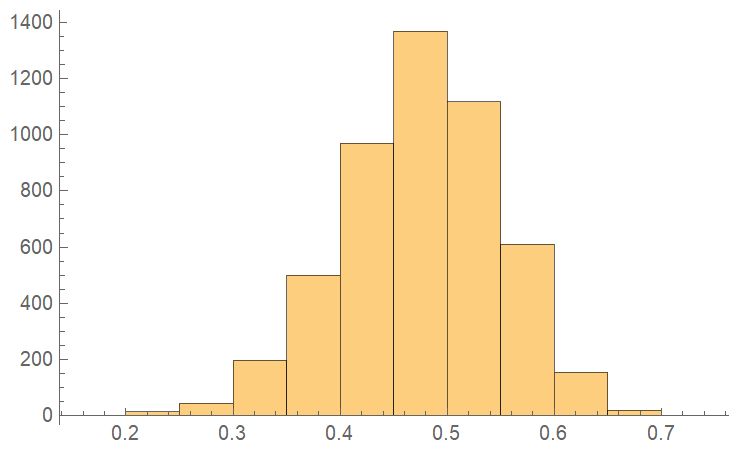
The histogram for this data (and a Johnson distribution fit to the data) is shown below:

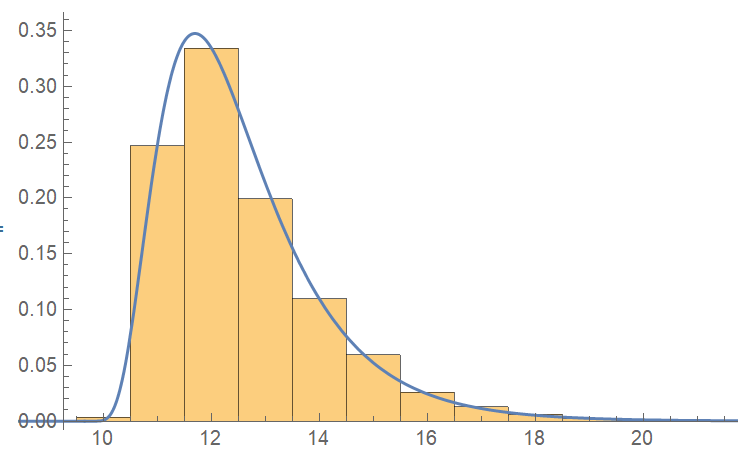
If everything lines up just right, the tournament could conclude in as few as 10 rounds, but is much more likely to take 11, 12, or 13 rounds, with 12 rounds being the most likely result. However, the distribution has a long right tail, due to the possibility of ending up with two dominant players, each of whom have few strikes. In this case, a large number of 1v1 matches (each assigning only a single strike) will be required to select a winner, potentially extending the tournament length significantly. If this seems likely, the TD might be compelled to call ‘sudden death’ once two players remain, doubling the number of assigned strikes to hasten the tournament’s conclusion, but this was not part of the simulation.

Compare this to a 47-person, 8-strikes tournament using the Fair Strikes scoring method, which has a similar mean duration. Again, 5000 tournaments were simulated, giving the following results:

Average duration = ~12.7424 rounds

  • 11 rounds: 3 sims
  • 12 rounds: 1820 sims
  • 13 rounds: 2659 sims
  • 14 rounds: 498 sims
  • 15 rounds: 20 sims

The mean is very similar, but the scatter is greatly reduced. Since the rules dictate last place on a game always receives 2 strikes, the right tail of the distribution is greatly truncated. The tournament will conclude in anywhere between 11 and 15 rounds, with 13 being the most likely and ~12.7424 being the mean.

Conclusions:

Progressive Strikes is the most ‘fair’, since it preserves the desirable attribute of monotonic scoring - beating another player is always better than losing to them. However, it has a somewhat high variance which introduces the possibility of a tournament running over its allotted time, or at least concluding in a somewhat uncertain amount of time.

Fair Strikes sacrifices monotonic scoring, but gives the TD greater assurance over the tournament length, and may be a better choice if time is a constraint.

9 Likes

It is interesting how different your results are to TGP Guide

They are computing different things, the TGP simulations have equal probability of any player winning a match. But still I am surprised by the result.

This is really solid work! Ive wanted to run similar sims but never find the time. I’d love to see your code if you don’t mind.

Other than expected number of rounds, another interesting outcome to examine might be the agreement between the tournament outcome and the ground truth skill ratings (using something like kendall tau). This will give a sense of how well a tournament is correctly measuring the skill of players, and the point at which there are diminishing returns for adding additional strikes/rounds.

Regarding the values in the TGP Guide: They may be measuring something different than I am to determine TGP value. Average number of rounds to conclude the tournament is not necessarily the best metric upon which to base the value multiplier. Perhaps they are using a different metric, like the average number of games played by all players, or a blend of multiple metrics.

I had to look up the Kendall Tau definition - never seen that one before. I measured it for the 47-player, 10-progressive-strikes tournament using the player and game score models previously described. The correlation was between ranking (with all players ejected in a given round put into the rankings in no particular order) and player base skill level. I ran 5000 simulations and produced this histogram of Kendall Tau coefficients, with a mean of 0.475676:

If every player is given equal skill, the histogram is clustered tightly around zero. But we know a real tournament has players favored to win. I suspect real tournaments have a higher Kendall Tau coefficient than my simulation.

I believe the simulation that @keefer built pulls the rounds that should be counted at 1X, 1.5X or 2X to help us estimate TGP.

1 Like

Do you know how the simulation chooses to count a round at 1X, 1.5X, or 2X? I wonder if it’s based on the number of remaining players. I’m also curious to see the results of another simulation. I have reasonably high confidence in my code, but it’s always possible there’s a bug.

Four years ago I made a page available listing the tournament duration for knockout tournaments using the real-world results in the Match Play database. That was back when Fair Strikes were invented.

The page broke a long time ago because it was getting all data for all tournaments and there are just too many tournaments to do that.

Anyway, this thread inspired me to bring it back! So if you want to look at real-world data head to: https://next.matchplay.events/stats/knockout

You have to apply a couple of filters to avoid making the database sweat too much.

Fun fact: A 47 player knockout tournament is not very common. Most knockout tournaments are much smaller.

Caveat: You can’t filter by the number of strikes awarded in three-player groups (not relevant for progressive/fair strikes)

Caveat: You can’t filter by player pairing type. Some people are monsters and use balanced instead of swiss

4 Likes

MONSTERS! :smiley:

1 Like

If more than half the groups are 4 player, it’s worth 2x. If more than half are 3 player groups, those rounds are 1.5x. If majority are 2 player groups, 1x.

1 Like

Yeah, I just recently learned the “more than half” rule. Which is really nuts when you think about it. A tourney with 12 players(3 groups of 4) gets the 2x whereas a tourney with 17 players(2 groups of 4 and 3 groups of 3) only gets 1.5X. Not really relevant to this strikes thread but it is interesting.

This real-world data is very useful for comparison. I immediately notice some discrepancies between real tournaments and my simulation.

For example, looking at the Group Knockout, 10 progressive strikes category, with a number of players between 11 and 20, the data shows two tournaments ending in 9 rounds and eight tournaments ending in 10 rounds. My simulation says that 11-player 10-progressive-strike tournaments end anywhere between 11 and 16 rounds, and that 9 or 10 rounds never occurs (0 results in 5000 simulations). So either the TDs applied some ‘sudden death’ rules, or players dropped out of the tournament, or the pairing type has a bigger effect than I think it does, or my simulation is bugged.

What an odd rule. Does it apply to strikes tournaments, or only other types of tournaments?

With that few tournaments who knows what happened. Sudden death seems likely, but could also be abandoned tournaments. I probably wouldn’t put too much faith in numbers until there are 50+ tournaments to compare (so you know the tournaments are coming from multiple organizers in multiple locations)

I think it technically applies to matchplay events too. Remember. If a tournament is not taking long enough, IFPA takes away some of the value.

Does your simulation take into account the fact that almost every progressive strikes event I know about changes to 2 strikes for the loser once it’s down to two people?

Awesome! You’ll want to repeat this across a range of simulation parameters and observe the outcome. You can just record the mean of the 5000 runs. For example, what is the difference in mean Kendall Tau between 3 strikes vs 10 strikes? or maybe 10 strikes and 11 strikes. The goal here determine how well different tournament formats correctly sort players according to their true skill. (If you want to really ruffle feathers, simulate Flip Frenzy and compare the outcome to other formats.)

If Tau is too much work you could also record the proportion of the simulation runs in which the highest skilled player finished first in the tournament. Sorry, not trying to make more work for you – feel free to ignore these suggestions!

This makes sense – when all the skill levels are equivalent there shouldn’t be any correlation, as the result of the tournament is pretty much random. Also there’s no variability in skill, so I’m surprised it just didn’t spit out an error. I thought you were sampling from a distribution of skills though, right? We never know what the Tau is for a real tournament, as we have no way of knowing a players true skill level. I guess you could use ratings or something, but the beauty of simulations is that you have a known ground truth value.

1 Like

No, it does not. That may be the source of the discrepancy in number of rounds between the real-world data and my simulation.

Using my previously described player model, a progressive strikes tournament with 47 players and N strikes gives this average Kendall Tau coefficient (using 5000 simulations again):

  • 3 strikes: 0.297
  • 4 strikes: 0.341
  • 5 strikes: 0.376
  • 6 strikes: 0.403
  • 7 strikes: 0.423
  • 8 strikes: 0.443
  • 9 strikes: 0.461
  • 10 strikes: 0.475
  • 11 strikes: 0.491

This seems like a lower Kendall Tau value than we would see in the real world, where we consistently see the same few players in the finals. So I decided to modify my game score model - the second parameter of the log-normal distribution now changes from 0.5 to 0.25, meaning the best players are now highly favored over even average players. Re-running the same simulation with this tighter game score distribution produces these average Kendall Tau values:

  • 3 strikes: 0.463
  • 4 strikes: 0.518
  • 5 strikes: 0.551
  • 6 strikes: 0.574
  • 7 strikes: 0.596
  • 8 strikes: 0.614
  • 9 strikes: 0.628
  • 10 strikes: 0.638
  • 11 strikes: 0.648

Here is the updated game score distribution for players of various skills.

1 Like

Just chiming in to note that I dislike this custom rule, as it can negate the competitive advantage that one player earned over the other. I use a slightly different method to speed things up while maintaining the earned position to that point.

For example, 9 strike progressive. Down to 2 players who have 5 strikes and 6 strikes. Clearly nobody wants to deal with a possible 6 games of head to head play here, we can all(?) agree on that. But instead of 2 strikes per loss which would put them both 2 losses from elimination, I manually add the same number of strikes to both players so that the one with more strikes is one loss away from elimination. In this example they would move to 7 and 8 strikes respectively, which maintains the advantage but still speeds up the end of the tournament. Why isn’t this the more common approach?

8 Likes

I think the trailing player will always prefer the 2 strike solution, especially in situations like your hypothetical where each player has 3 or more strikes remaining. This way they can survive at least one loss, using the cushion they “earned,” as opposed to sudden death. TDs are only human, and probably don’t want to deal with the inevitable whining.

Good players generally want as much play as possible. As a speed zealot I prefer the sudden death option.

1 Like

Yeah, if time isn’t an immediate issue I’m also cool with putting the player with more strikes 2 losses from elimination. As long as the solution is in the rules ahead of time and minimizes a potentially long and tedious 1v1 slog without throwing off any earned advantage between the two players I’m good with it!

1 Like

We tried Progressive a few times, but I’ve moved to Fair Strike when I want to run a Strikes event. Players stay active longer, but then it gets (purposely) brutal at the end where you basically need to win to move on. Progressive unfortunately suffers from the long-tail problem.

1 Like