2022 NACS forecast for all states/provinces. **NOW WITH PLAYER VS PLAYER PREDICTIONS.**

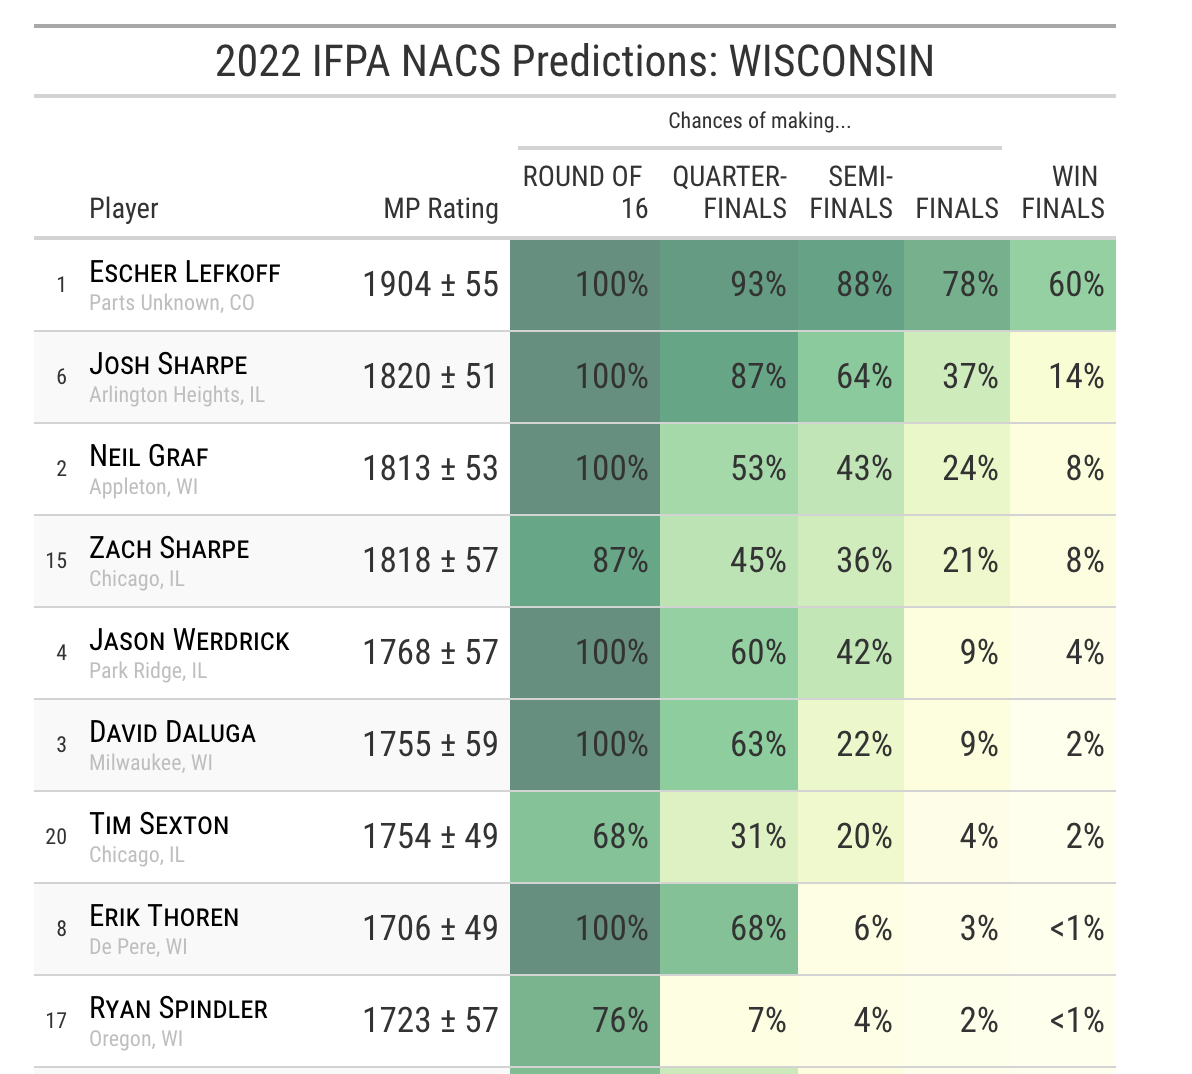
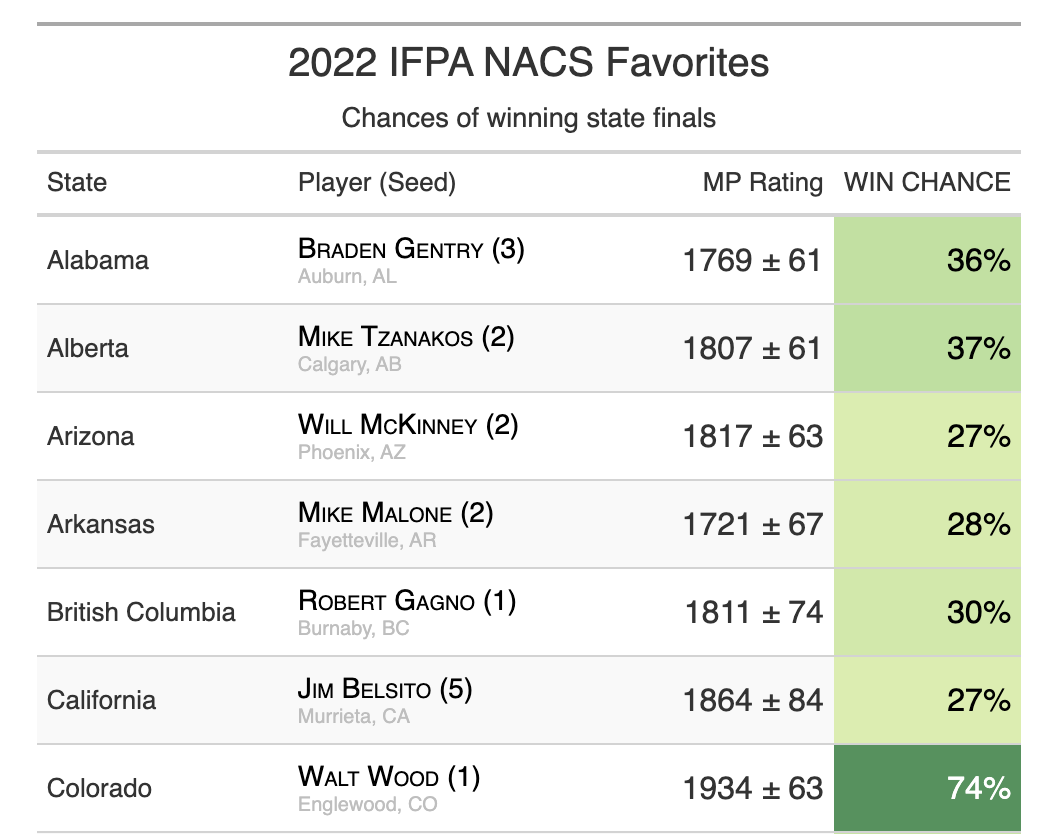
I was inspired over the holidays to learn some new R package. This somehow snowballed into forecasting the results for all the NACS finals and creating FiveThirtyEight style tables to summarize them ¯\_(ツ)_/¯. A snapshot of the main table is below. Check out the full results here!

You can also view predictions for all players in each state/province.

These predictions are based on simulations using everyone’s matchplay ratings. For the most part, I think the ratings do a pretty good job. There are definitely some quirks — for example, it gives four-time Texas champ, Colin MacAlpine, only a 6% chance of winning of winning Texas. Having lower odds makes some sense, as Colin doesn’t have a bye and his seed gives him a relatively difficult path to finals. But I also think some of his potential opponents are massively overrated (cough philgrimaldi cough). Of course we’ll see how it plays out!

I’m definitely wary of sharing tables that say someone has a “<1% chance” of winning — please know that this is not necessarily my opinion or your skill, just the results of a simulation with a naive/imperfect model! I very much hope some of these 1%'ers prove the odds wrong.

As always, thanks to Matchplay(@haugstrup) and IFPA(@Shep) for providing APIs that make this kind of thing possible.

Enjoy! And do let me know if you have any questions, feedback, or suggestions for improvement! This was just a fun side project, so there very well may be errors. Let me know and I’ll get them fixed ASAP. Also, I will probably rerun the simulations next week to account for any changes in the matchplay ratings.

Edit: Arkansas, Louisiana, & Virginia have now been added. Nova Scotia and North Dakota do not have an even 16 players, which my code cannot handle, so they are not included.

UPDATE (1/13): There was a major bug in my code, and the previous results were showing the odds for a best-of-1 series instead of a best-of-7. Tables have now been updated. For the most part the relative ordering of players will be similar. However, the %'s are now a lot more opinionated, especially in states where there is only one or two heavy hitters. Apologies to anyone who ran out to Vegas with those previous numbers. Thanks to @Pinball_Yeti for pointing this out!

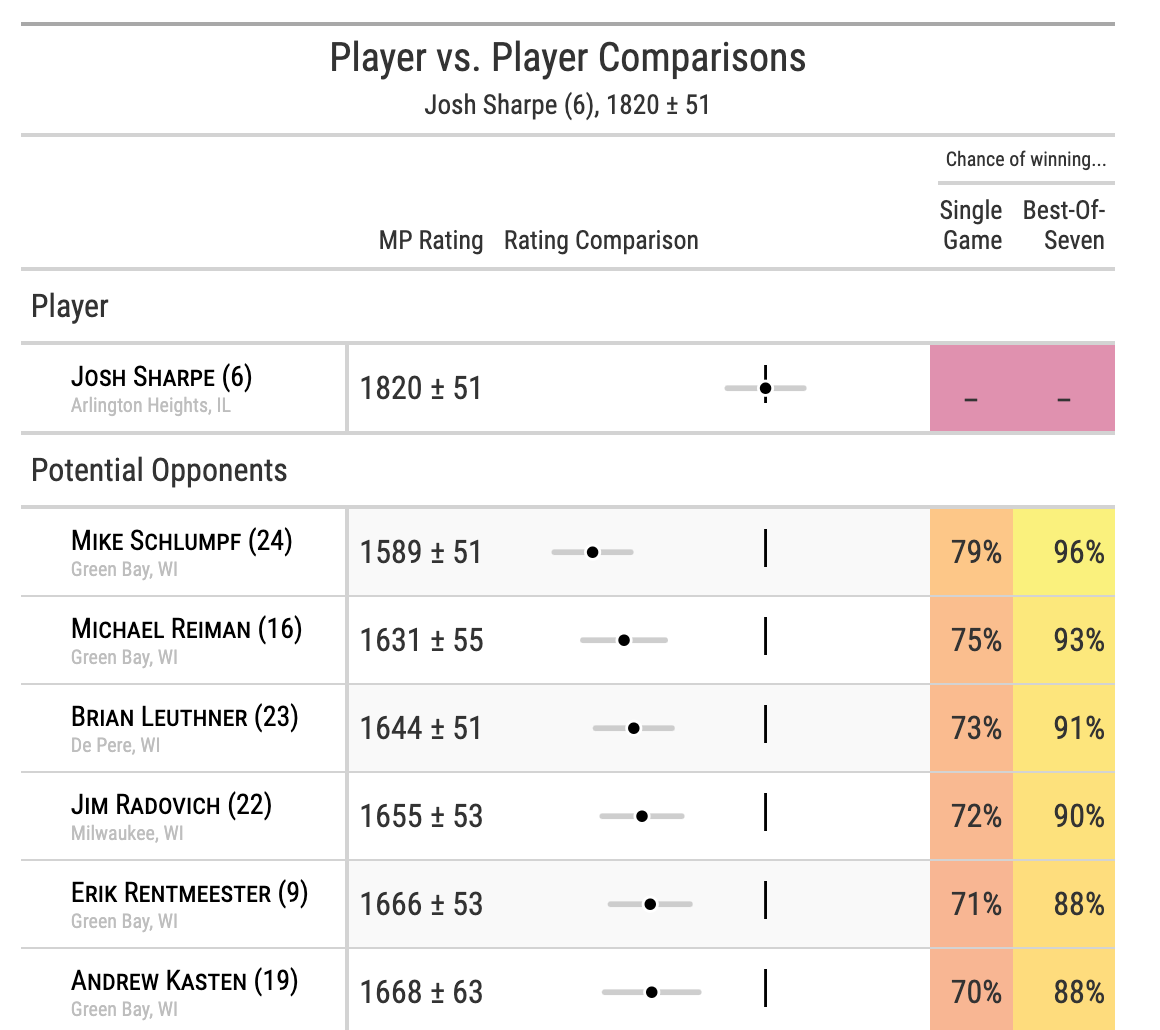
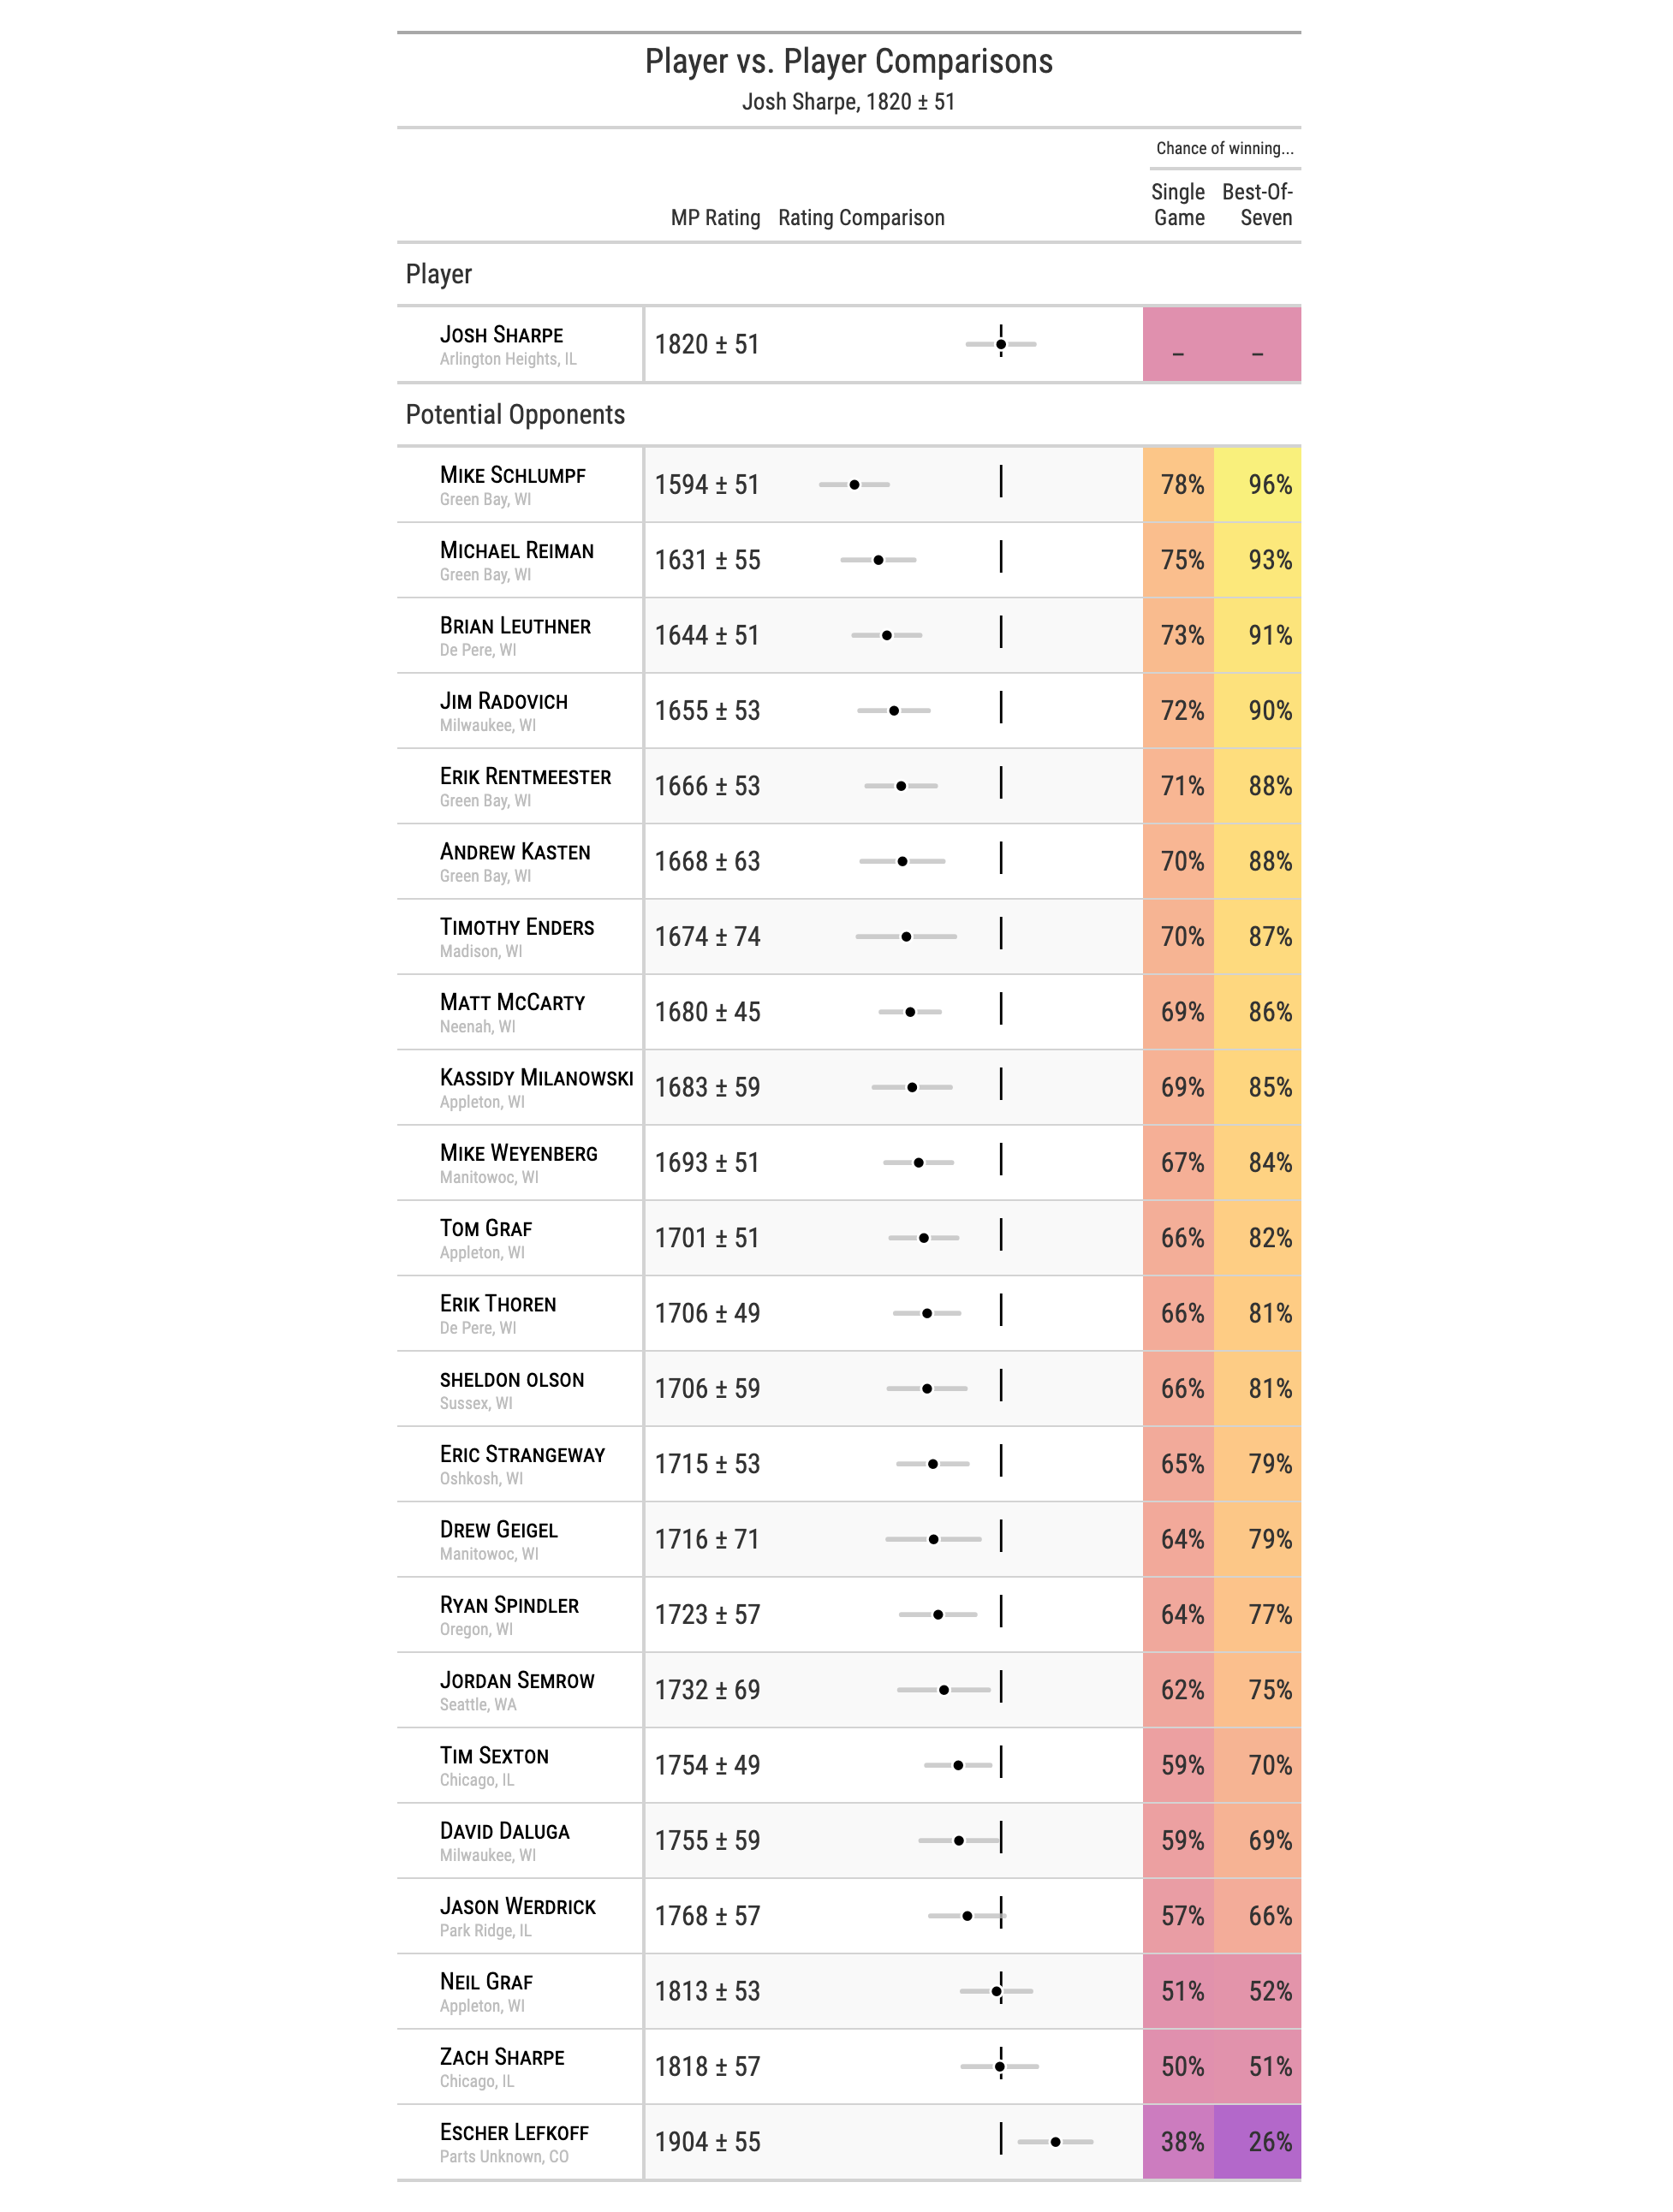
FINAL UPDATE (1/19): I reran simulations with a fresh pull of ratings from matchplay. Results may have shifted if ratings changed. I also corrected any states that I was informed had changed, which may have also affected outcomes. Lastly, I have added a new feature that compares each player to all others in the field, so you can see the predicted outcome of all possible matchups.

10 Likes

Super awesome and I love the 538-style tables!

It would nice to right-click on on a state and open in new tab. It re-directs to the main page and I still have to cllick the state/province tab and the state.

It would also be cool to have their State Seed next to their name on the main page. I found myself clicking state-by-state to who was the lowest seed that was predicted to win. Looks like Tommy Skinner from IN at the 19th is the highest I saw.

Once the States/Provinces happen, it would awesome to try to compile all the bracket results in the same dataset somewhere, and then make a 950 person+ bracket once Nationals happens.

1 Like

Agree. I wrote the code to do this but it was messing with the formatting and I couldn’t get it to work. I’ll mess with it some more.

I’ll also add seed to main page too. Good idea!

Oh man if states actually kept their brackets up to date you could have live results changing and make an actual map with percentages. “Georgia has been called for Dalton at this point with a 75% chance of him winning”

7 Likes

Georgia too close to call. May have to go to a run off.

3 Likes

This is interesting and thanks for creating it!

The projections may be off from the true chances because in the state championships players get to pick the games, so the favorites probably have a better chance than projected. A lot of the matchplay ratings calculation comes from tournaments where the players don’t get to pick the games. If the better player gets to pick 2 games out of 7 that they are a heavy favorite on, then it forces the other player to go 4-1 on the other games, and if those 5 games have a lot more luck it’s still hard for the underdog to win.

It’s still interesting and the projected favorites in each state are pretty accurate, but maybe players with a 20% chance of winning their state are more like 30% or 40% and players at 5% are more like 1%.

Very cool stuff thanks for the effort in putting all this together.

1 Like

well it’s sill based on game setup and what games are at each site

This is awesome and for sure has me pumped to head down to Vegas even more than I already was :rofl:

Any way you could calculate the same tables with the “lower bound” MP rating? May shake things up a bit…

1 Like

The projections may be off from the true chances because in the state championships players get to pick the games,

Totally agree. Theres an old saying in my field “all models are wrong. some are useful”. It would be somewhat easy to add a first player/game choice advantage to the model, but first determining how much that advantage should be is non-trivial, and I’m not sure how much it would add at the end of the day. Another thing I’m not accounting for is the bank of games that is available. If the bank is heavy on modern, controllable games, the higher rated player has an even stronger likelihood of winning, compared to a bank that is heavy on classics/EMs. Quantifying the “luck factor” of the games is something that has been on my radar for a while, but haven’t had the time to do it. I’m also not sure if the added complexity is worth it. I’m also not accounting for any “home field advantage” local players may have. the list goes on :sweat_smile:

Any way you could calculate the same tables with the “lower bound” MP rating? May shake things up a bit…

The predictions already take into account the uncertainty/rating deviations. I didn’t include that detail in the “about” section to keep it simple. For many of the states, most of the ratings had pretty low RD values, so it shouldn’t matter much for those.

3 Likes

Wow this is very cool! And a bit disheartening to see my odds, hah!

How did you come up with the names for each state? For example in Maryland, the #16 seed on the IFPA list is not on your Maryland list anywhere. Neither is this person on the DC list here, but they are listed in DC on the IFPA page.

Also, I don’t see Virginia included? I mean the whole state. Maybe it’s in your data but got overlooked when you made the links to the individual states?

Great job though, I really like this!

1 Like

There was a highly technical process of copy/pasting the tables from the IFPA site. The number 16 seed for maryland (Douglas Malcolm) is indeed on the table, but he’s listed as the 19 seed. For some reason the seeds have changed even after the rankings were supposedly locked in so idk what happened. Seed matters a lot for the probabilities, so I’ll have to rerun maryland, thanks for letting me know! Which player on DC list is wrong?

At the time I published this, Virginia had not finalized their field and so I didn’t bother running them. It looks like it is done now so I’ll rerun them along with Maryland.

In case anyone else is wondering, Arkansas and Louisiana are not included because the fields have not been finalized. North Dakota is not included because they are unable to field a 16 player bracket and my flimsy code cannot handle that. Similarly, Nova Scotia has a rare 4 way tiebreaker for the 16th position. Until that is resolved I am going to remove them.

Thanks! The glass-half-full take is that the top dogs are not as untouchable as they sometimes seem :slight_smile:

2 Likes

Arkansas, Louisiana, & Virginia have now been added. Nova Scotia and North Dakota do not have an even 16 players, which my code cannot handle, so they are not included.

1 Like

Also, I’m surprised no one has said this yet…

han-solo-star-wars-never-tell-me-the-odds

:grinning:

3 Likes

Thanks for sharing! This is really cool!

But the mathematician in me couldn’t help but notice a problem with the simulation.
Your explanation for how the numbers are calculated says it accounts for the fact that each round is a Best of 7 series. But I think your simulation is only doing a single game for each round instead of a Best-of-7.

For example, it shows Josh Sharpe has a 70% chance of surviving his first match, which matches the 70% chance Matchplay gives for an 1820-rated player beating a 1673 (or a 1660) for a single game.

But if the odds of winning a single game is 70%, then the odds of winning a Best-of-7 series = 0.7^4 + (4)(0.7^4)0.3 + (10)(0.7^4)(0.3^2) + (20)(0.7^4)(0.3^3) = 87.4%. So Matchplay should have Josh’s odds of surviving his first Best-of-7 match at closer to 87%.

If you’re able to confirm the bug, and end up re-running the simulation, I look forward to seeing how that changes the probabilities!

7 Likes

Dude! Great catch–this was indeed a bug.

I had previously written some code to generate head-to-head tables for all the players. I didn’t end up including these initially because they took too long to generate. As you can see, though, the numbers align with what you came up with.

As you picked up, the problem was that in the main analysis I called the wrong function to simulate a single game instead of a series :person_facepalming:

After rerunning Wisconsin with the correct function, the picture changes considerably…

The sims are rerunning now, should have them updated later tonight. Thanks for catching this!

4 Likes

Glad I could help! That looks more like it! I thought Escher at 29% felt a bit low. :slight_smile: Thanks for going to the trouble of debugging and recalculating!

@spraynard some updates have been made to the qualifiers in Nevada (and my rating has gone up :laughing:). Would it be possible to get updated projections? Thank you!!! :wink:

Thanks for letting me know! If any other states have had dropouts, please let me know.

I’ll be rerunning final batch of predictions tomorrow evening.

2 Likes

Brian LeBlanc replaces Bill Richardson as the 16th seed in the Delaware State championships.

1 Like