SuperFinals are the new SuperLeagues.
Awesome tool Andreas!
Hey @pinwizj wondering what’s going on with the site right now? It looks like all tournaments are losing value.
Another formula change?
Nothing intentional . . . looks like something with the Ratings module not working quite right. We (and by we I mean Shepherd) will figure it out.
All the formula change stuff is private on our test site. You drop from 61st to 68th so you’ll probably hate it ![]()
That makes sense! Cool thanks for the response.
By test site do you mean that’s the new formula starting Jan 1 being tested? If that’s the case Im happy with 68 as I totally assumed I was moving down more. No hate from over here!
Yep . . . everything proposed for next year is in, and we’re also playing with the recipe of the IFPA Ratings calculation to help limit some of the craziness of the SuperLeague players becoming crazy overrated so quickly (and then the impact that has on the value of those tournaments).
3 Likes
Good news. Looking forward to seeing what you guys come up with
So for State Championships/Womens etc the results through and from Dec 31, 2015 are what counts right? since people may have last minute tournaments that won’t be submitted and live on the site until 2016 is there some way to see what the final 2015 #s are for folks? it won’t matter too much to me, but I typically throw a tournament around the end of the year.
Yes . . . here’s our procedure for “rolling over” to the next year:
We will typically leave 2015 open until January 5th to give enough time for people to get their end of the year results in. During that time we’ll be getting 2016 results submitted but we won’t be approving them until after the 5th.
Once I give Shepherd the green light, he locks the rankings in place as of 12/31/15 and we move them to a new table in our database. When we open up SCS registration, IFPA13 registration, and the Women’s Championship registration, that information will all be based on our “2015 History” table in the database.
Then we’ll roll over the system to WPPR v5.2, load in the current 2016 results that are in the backlog, rebuild everything and display the ‘new WPPR rankings’ going forward.
There is definitely a chance that 2015 results (especially adjustments to old results like combining player profiles) end up NOT getting in for 2015. We’ll make the change for the 2016 season no problem, but once we lock 2015 that shit is OVER ![]()
1 Like
I was looking at the TGP values for different formats and I think there is a minor error that is slightly undervaluing Best-of-5 and Best-of-7 formats. The expected number of games for a best of 5 format is 4.125 and 5.8125 for a best of 7, whereas the calculations appear to use 4 and 5.5 for the expected number of games. The difference isn’t that large, but it does change slightly if my math is correct.
I won’t begin to pretend to know how to calculate the EV length of a best of 5 series.
We went with the - “This match is either going to end in 3 games, 4 games or 5 games. So we’ll use 4 as the average for TGP purposes.”
Same things with the best of 7 formats . . . the length of that match is going to be 4, 5, 6 or 7 games, so we went with 5.5 as the average length of the match.
Yeah, it would only make a minor difference in the in the cutoff points for how many players to get an additional TGP for those formats, so not really that important.
Ooh ooh, I know this one!
The answer is math!
JMG’s 5.8125 is not actually accurate either, since it depends on the two players being equally matched. The expected number of games in a 5- or 7-game series is a function of the probability that the better player wins any of the individual games, with the longest series average coming when the players are equally matched. This article by pinballer Phil Birnbaum is relevant: http://blog.philbirnbaum.com/2007/06/winning-world-series-in-x-games.html. Real 7-game series actually go on longer, partially because of home-field advantage, but there are also more sweeps than would be expected by chance.
If you really wanted to figure this out, you’d dig into the data of how long these series go, and come up with an average based on real info. 5.5 is a very reasonable estimate when the players are not necessarily going to be of equal strength.
5 Likes
@pinwizj this came up in Match Play Events Open Thread - #102 by JimiWolf but is more relevant here:
More an FYI since at least two other TDs as well as myself have asked (and @haugstrup is adding in this great feature!), but doing series where not every event counts will be supported in the future. This is great for folks doing series where someone doesn’t have to be at every event (e.g. drop your lowest score so if you have a monthly submittted as one result to IFPA you can let the top three scores count since not everyone can always make every event). Our league does this too and I think a lot of folks like this format.
As an aside, in this format, will the 5.2 wpprs count all the games of a series, even if the winner only shows up say 2 out of 3 times?
I would assume that if only the scores from two events count towards final standings, then only two events worth of games count (no matter how many times the winner attends).
We always look at the data being used, so for a best 5 out of 10 games we take 5.
In this situation it’s complicated because it sounds like each meeting is a different TGP.
With us going ‘expected value’ this upcoming year I would say that we would average out the TGP for each session and then multiply that by the number of sessions used to determine the standings.
1 Like
I think often the formats will be the same over a series but I know it’s also fun to mix things up as I like to try and keep things fun for both newbies and the rest of ‘us’
I’m not entirely sure how that would work out, so here’s a Christmas example for ya Josh.
The series is a 3-legged event where each leg reward points on a set scale (100-97-95, etc). Players count their best 2 scores, and highest total score wins.
In all 3 events of the series, the same format is used, which is 6 rounds of head to head play followed by a single elimination, best of 1 playoff bracket for the top 8 finishers.
One player, Rudolf, plays all 3 legs and by a strange coincident, finishes 5th all 3 times. His total score will be 93x3= 279 minus his lowest score (93) for a total score of 186, which earns him 3rd place in the series. Another player, Prancer, wins the first event, doesn’t show up for leg #2, and shows up for another win in leg #3. His score will be 100x2=200.
How should we calculate the TGP?
This is easy. You’re counting two rounds towards a players standing, so the analysis is on what encompasses a round a data.
Sounds like it’s 9 games played per ‘session’? (6 h2h matches followed by 3 games played for finals)
So TGP would be 72%, for the 18 games played.
2 Likes
Some people may have heard of the rating change coming to WPPR v5.2 which can be found here:
http://www.ifpapinball.com/menu/rankings-information-2016#rating
“The IFPA Rating will only be adjusted based on the 32 players above and below a player’s finishing position for any given tournament result. For example, a player finishing 5th in a 60 player tournament will have their IFPA Rating impacted based on losing to the players that finished 1st through 4th, and beating the players that finished 6th through 37th.”
This change will have a huge impact on the value of events, since this change will go into place from the beginning of time through today. One of the biggest tournaments impacted by this change will be Pinburgh, where A division players may have something like an .850 win percentage against hundreds of opponents, far more than you would ever see in a Chess tournament or most sports.
You used to be able to estimate how much your rating would change based on your distance from the median finisher, this made tournaments with many players, but low participation, cough superleague cough very valuable, because you would be guaranteed hundreds of victories. If the same 50 players are competing against 200 other players who do not have a full ticket, the head-to-head between the active players meant less compared to the 200 players they were not playing.
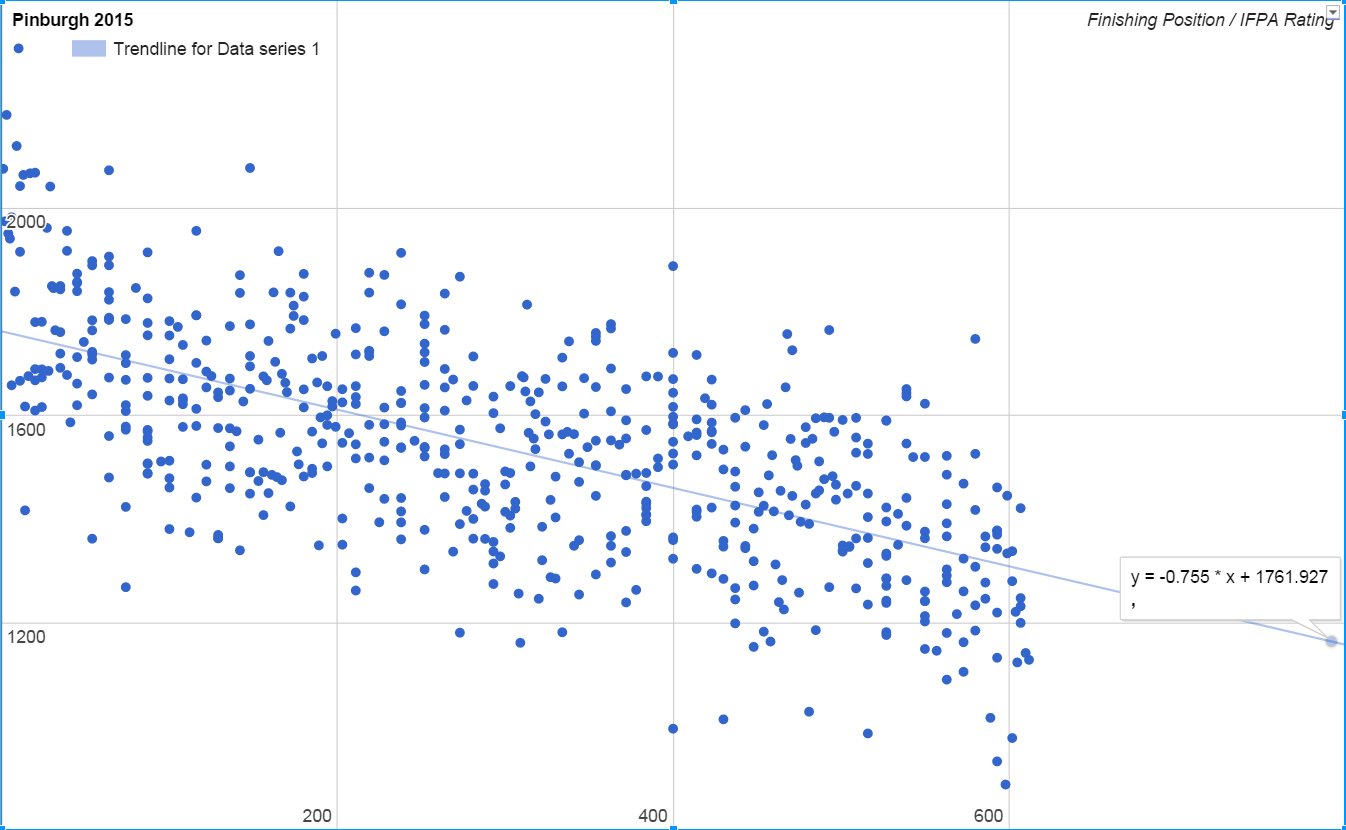
By using a trendline, players who are outside the top and bottom 32 could estimate where they will need to finish to have their rating increase. Using this year’s pinburgh data, before any changes, solving this formula would tell you where you will likely need to wind up to see your IFPA rating increase
Min_Finishing_Position = ( Current_IFPA_rating - 1761.927) % -0.755
If your rating was 1600, you would need to finish in 214th place or better
If your rating was 1400, you would need to finish in 479th place or better
3 Likes
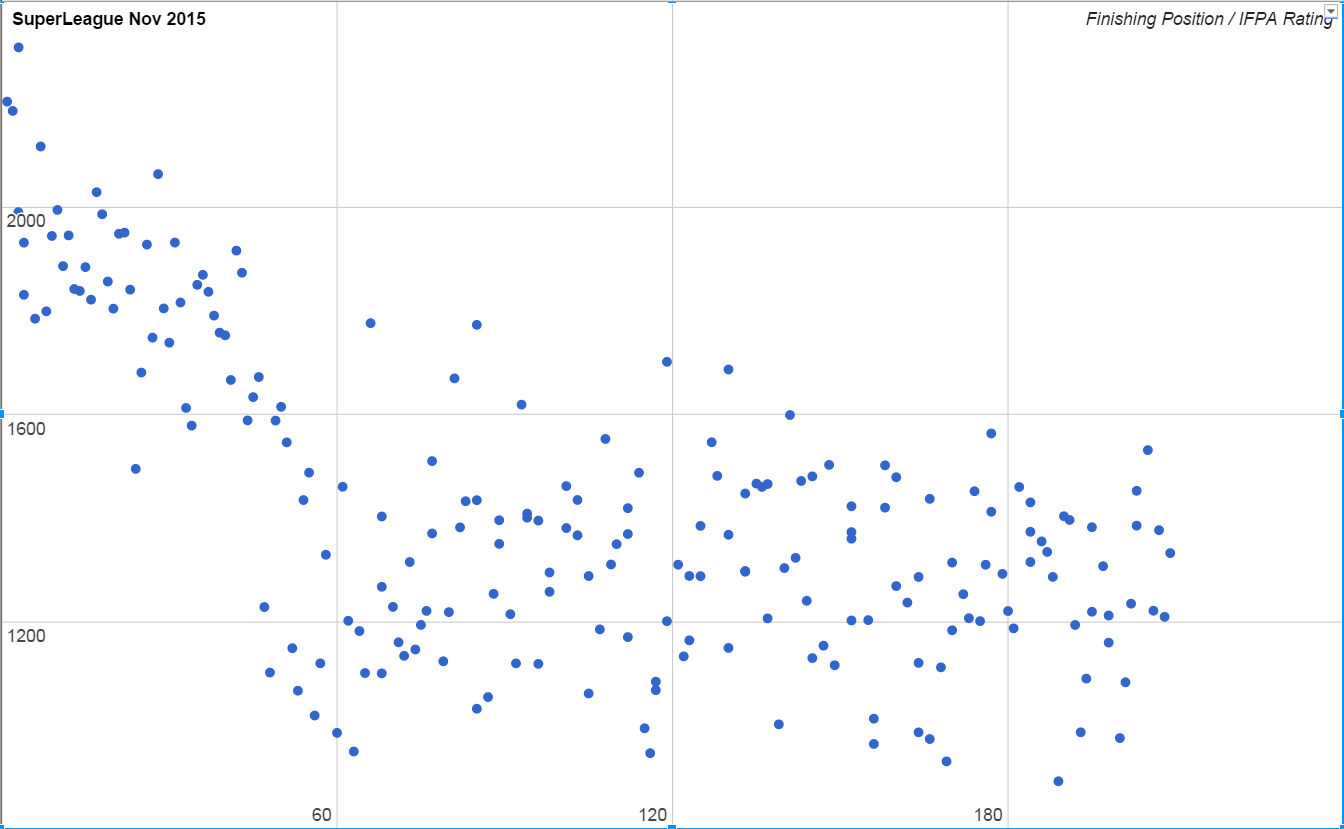
You can see how this was a problem in the past by looking at superleague results, where there is a much different-looking scatterplot.
Full SuperLeague Results
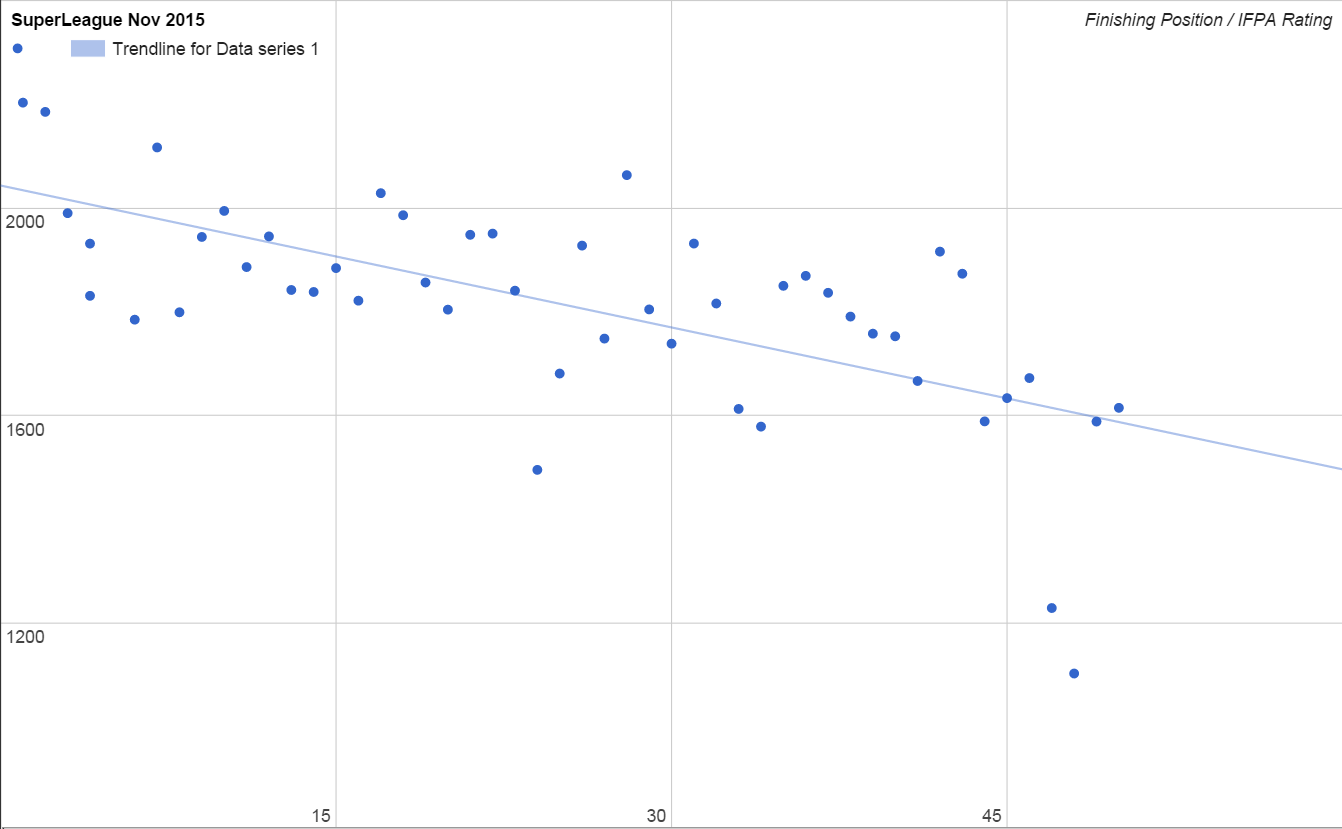
Top 50
51-Last place
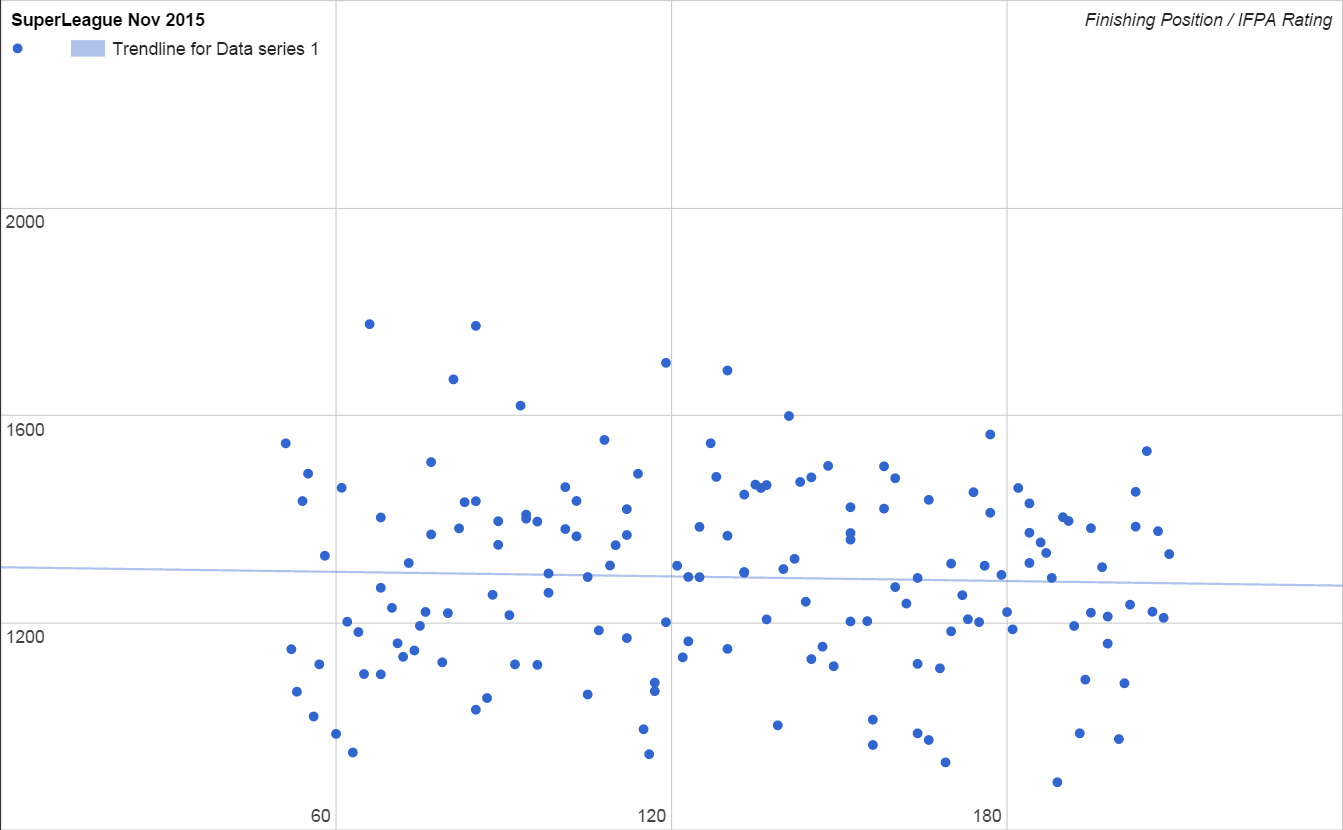
Among the top 50 players there is a very strong trend, but it’s inflated well over the rest of the field (and the rest of the players in IFPA)
2 Likes