I have revisited the simulation of strikes tournaments, this time using Python for better accessibility (code included!). The simulation is also far more thorough.
Player Model:
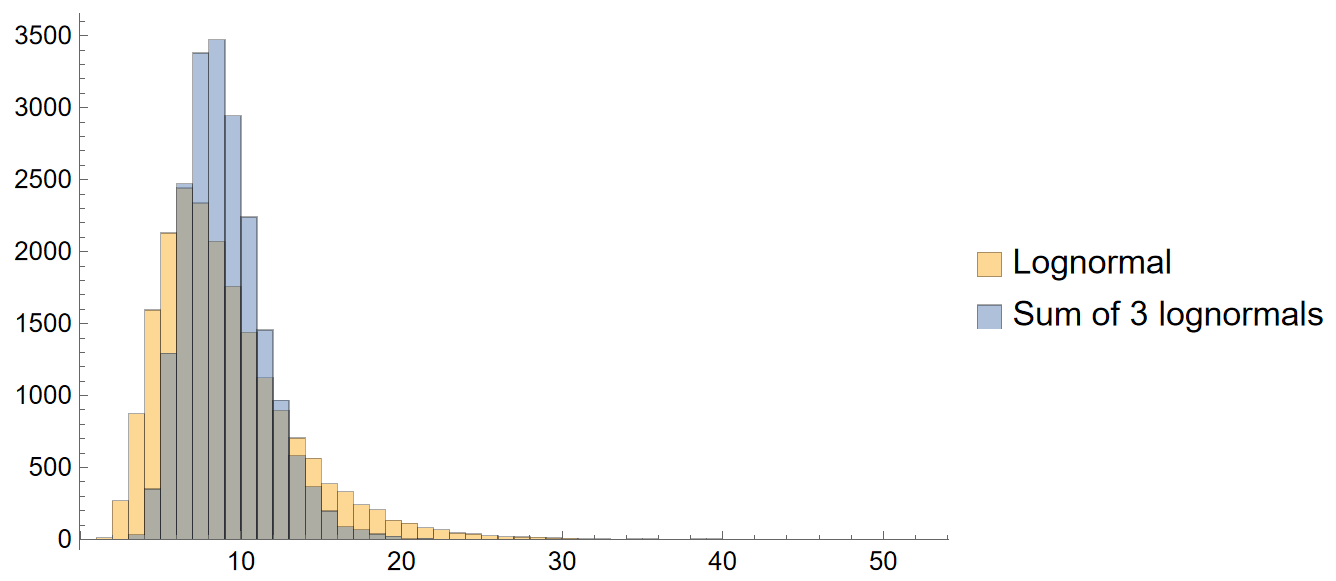
Players have an intrinsic skill parameter chosen from a log-normal distribution:
lognormal(0, 0.25)
This parameter represents the player’s ability to achieve high scores. The skill distribution looks like this:
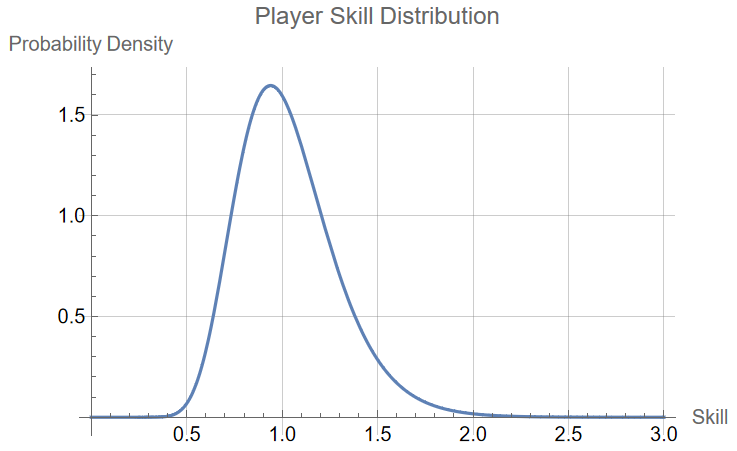
The average is close to 1, representing a skill level typical of a tournament player. The left tail tapers off around 0.5, representing a newer player with less ability. The right tail tapers off around 2.0, representing a top-tier player (someone in the top 50, for example).
Game Score Model
To simulate the unpredictability of a pinball game, a player generates a score chosen from another lognormal distribution. This time, the first parameter is the player’s intrinsic skill, and the second is a scatter parameter of 0.45 (more on this value later):
lognormal(skill, 0.45).
Game score distributions for players of skill levels 0.5, 1.0, 1.5, and 2.0 are shown below.
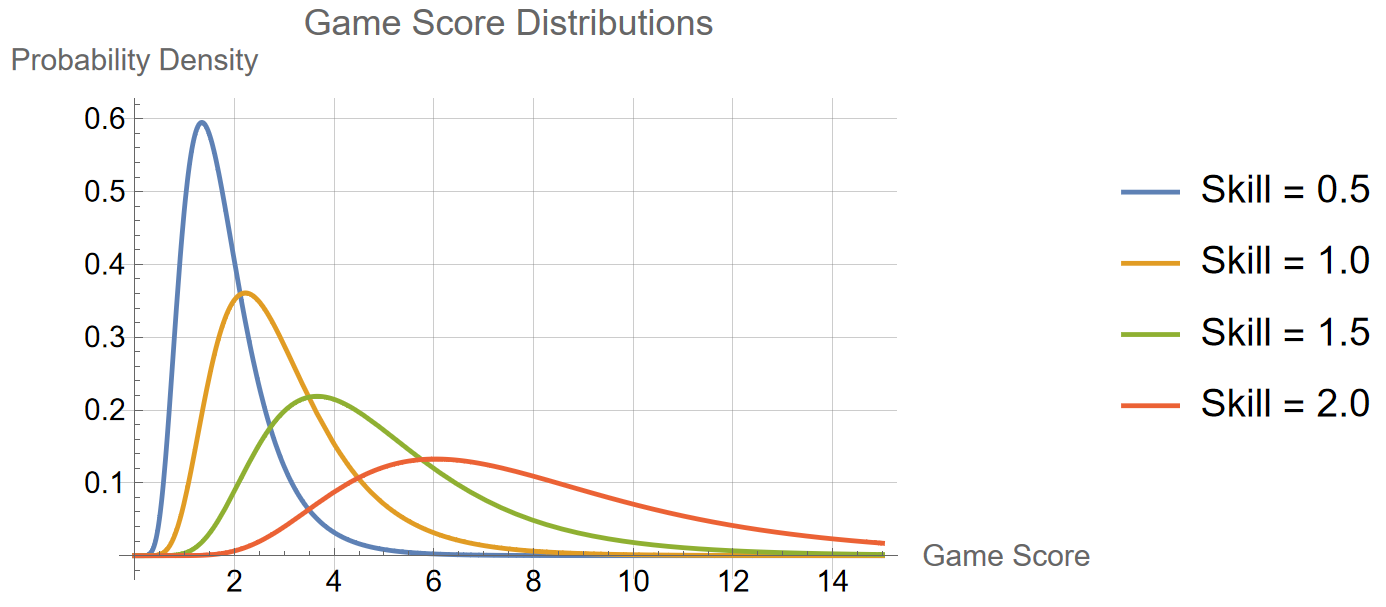
It’s possible for a lower-skilled player to beat a higher-skilled player, but this is increasingly unlikely the further apart their skill levels are. Consider the following pairings:
- 0.5 skill vs. 1.0 skill: Higher skill player wins 78.4% of games
- 0.5 skill vs. 1.5 skill: Higher skill player wins 94.3% of games
- 0.5 skill vs. 2.0 skill: Higher skill player wins 99.0% of games
- 1.0 skill vs. 1.5 skill: Higher skill player wins 78.4% of games
- 1.0 skill vs. 2.0 skill: Higher skill player wins 94.3% of games
- 1.5 skill vs. 2.0 skill: Higher skill player wins 78.4% of games
The score scatter parameter of 0.45 was modified slightly from my previous simulations, where it was 0.50. The reason is an analysis of a couple tournaments which took place at District 82: an 8 Fair Strikes tournament on August 11, 2022 with 107 players, and another 8 Fair Strikes tournament on August 19, 2023 with 117 players. Using the lower bound of each player’s rating (as extracted from matchplay.events circa March 1, 2024) to represent player skill, the Kendall tau parameters for these two tournaments were calculated to be ~0.35 and ~0.54, respectively. Therefore, I chose the scatter parameter such that my simulation produced an average Kendall tau of ~0.45 for these tournaments, roughly halfway in-between. This is a very small sample size, but it was time-consuming to analyze the tournaments.
Note that as the game score scatter parameter increases, average Kendall tau for a tournament will decrease. Both the game score scatter parameter and the Kendall tau being 0.45 is a coincidence.
Tournament Types
Five types of strikes tournaments were examined: Progressive Strikes, Fair Strikes, Lenient Group Strikes, Oprah Strikes, and Single Strikes. The players receive strikes according to these rules:
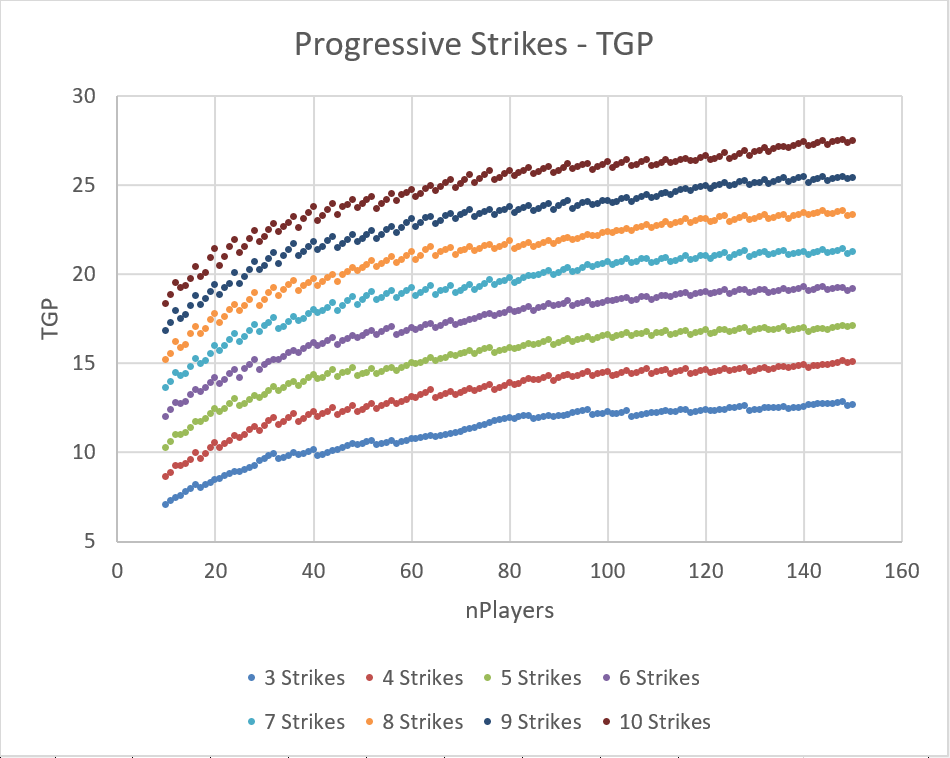
Progressive Strikes (Swiss Groupings)
- 4 players: 0/1/2/3 strikes
- 3 players: 0/1/2 strikes
- 2 players: 0/1 strikes
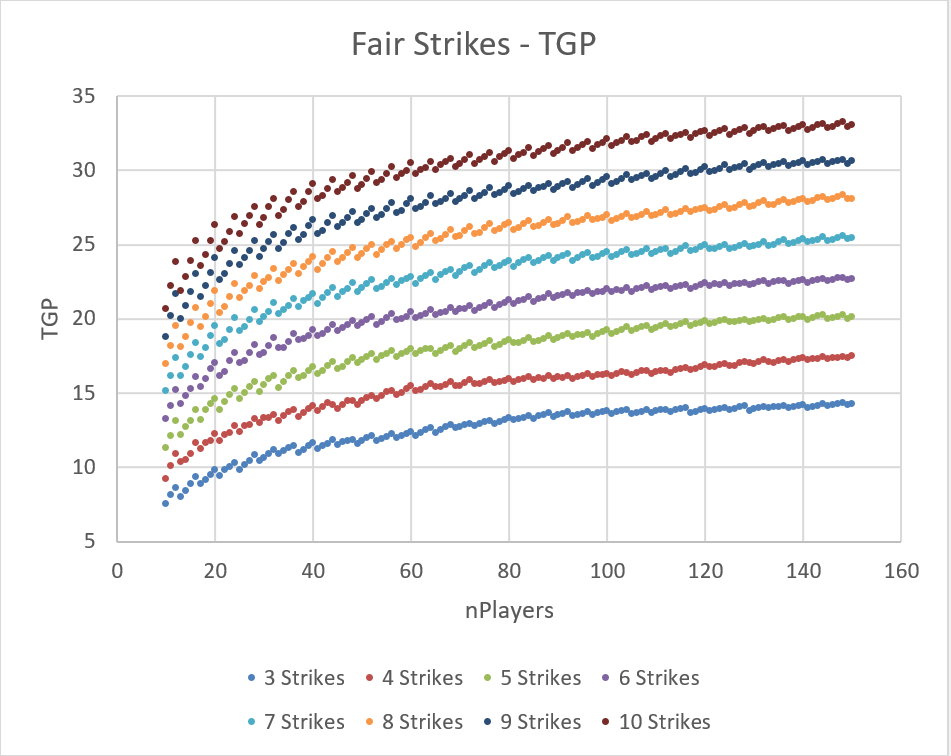
Fair Strikes (Swiss Groupings)
- 4 players: 0/1/1/2 strikes
- 3 players: 0/1/2 strikes
- 2 players: 0/2 strikes
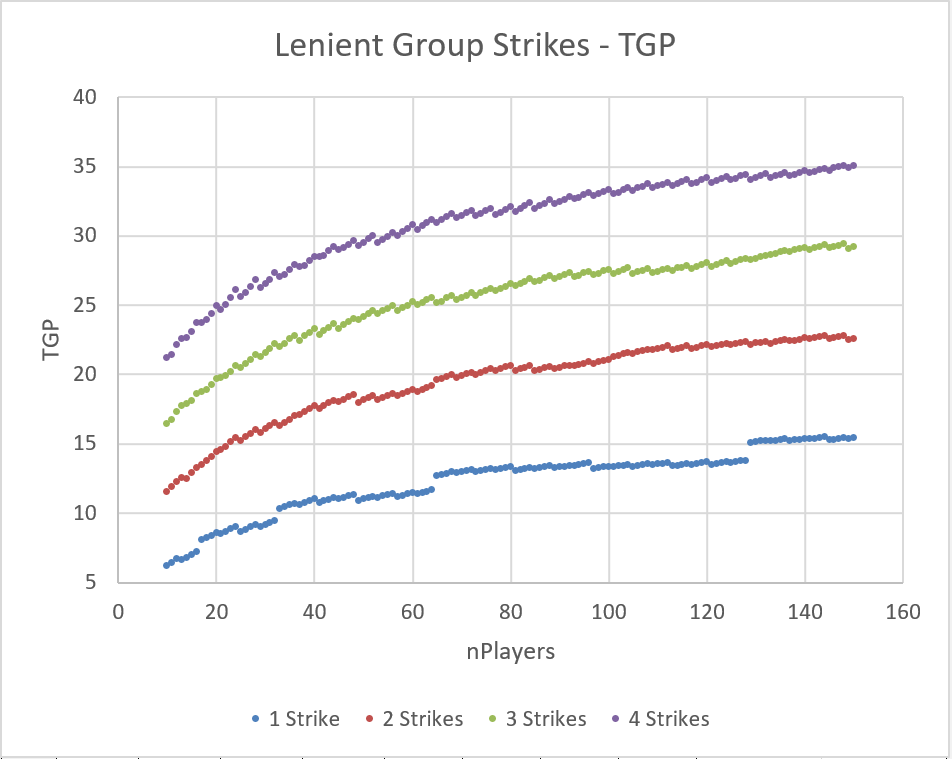
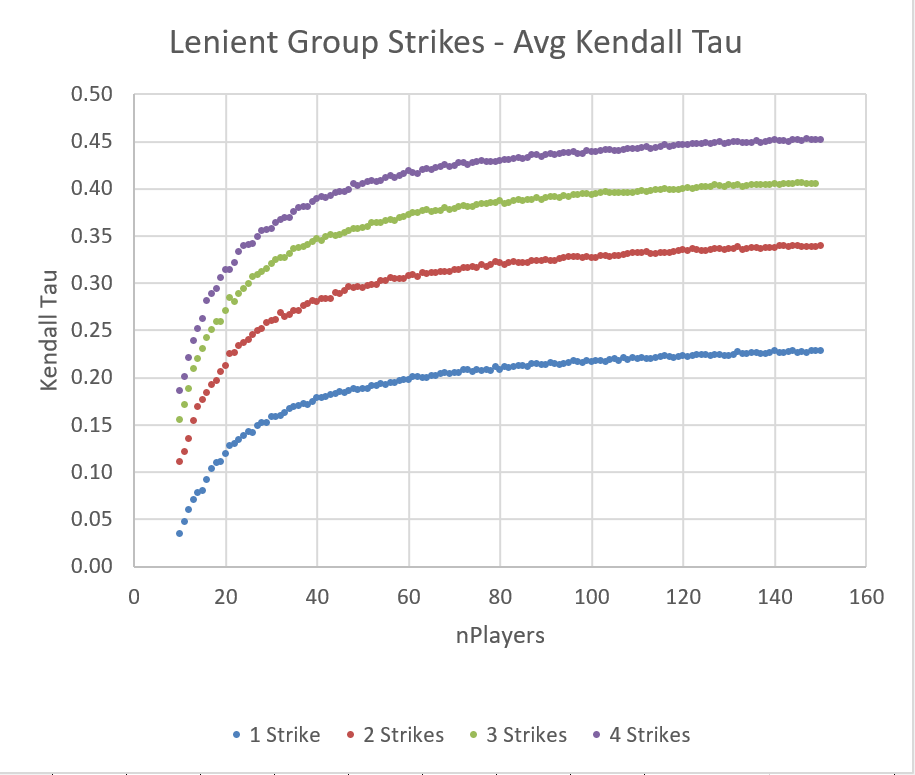
Lenient Group Strikes (Swiss Groupings)
- 4 players: 0/0/1/1 strikes
- 3 players: 0/0/1 strikes
- 2 players: 0/1 strikes
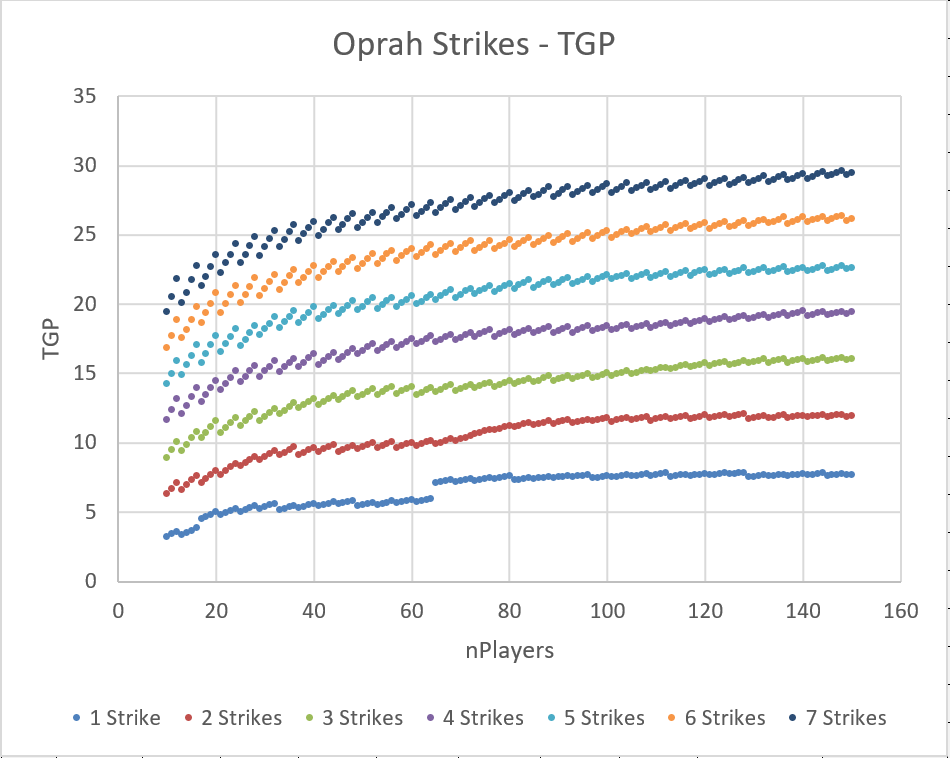
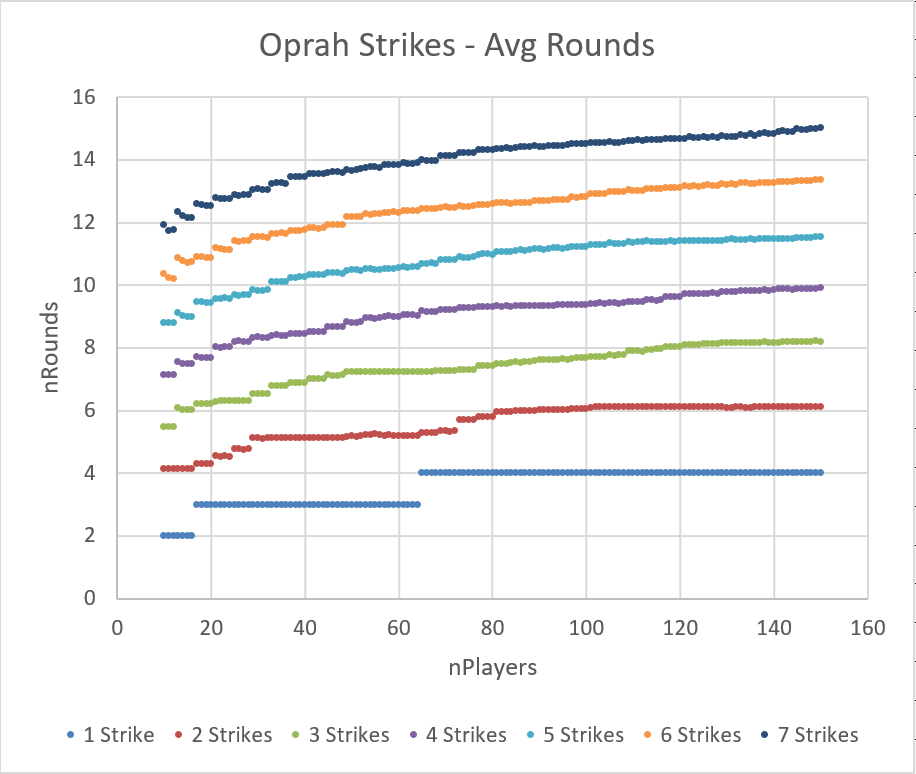
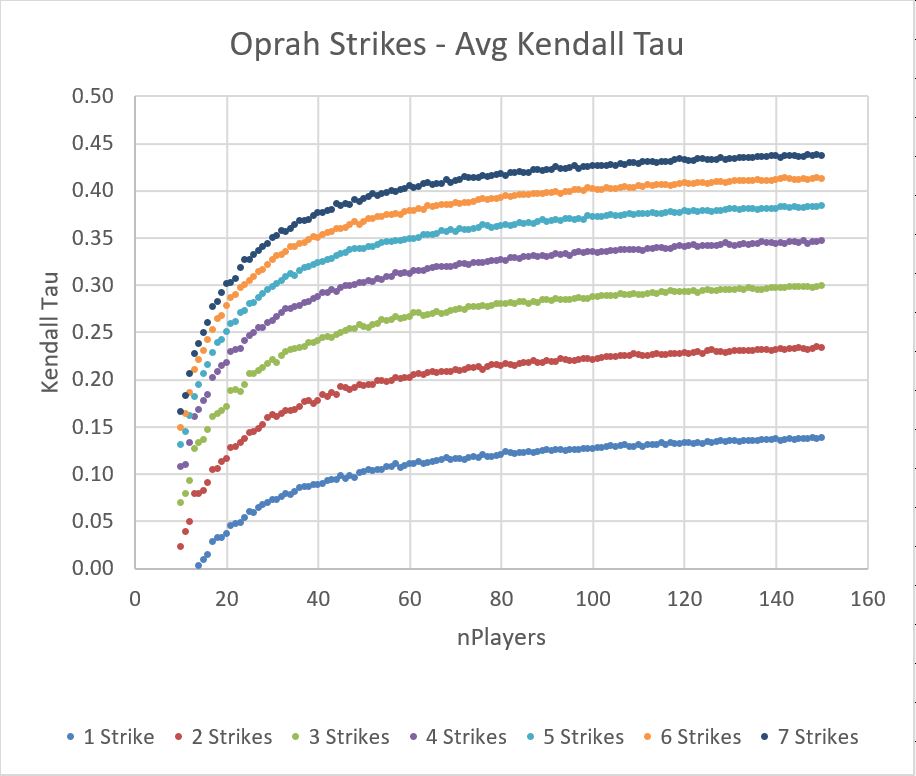
Oprah Strikes (Swiss Groupings)
- 4 players: 0/1/1/1 strikes
- 3 players: 0/1/1 strikes
- 2 players: 0/1 strikes
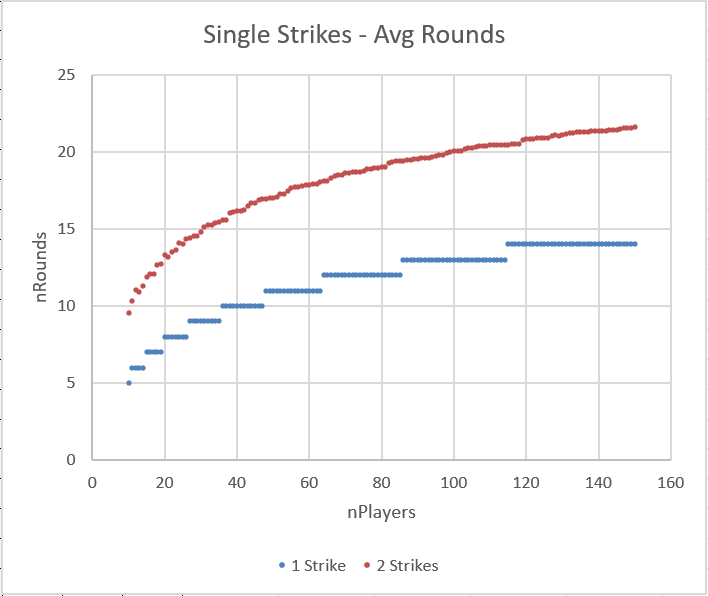
Single Strikes (Swiss Groupings)
- 4 players: 0/0/0/1 strikes
- 3 players: 0/0/1 strikes
- 2 players: 0/1 strikes
Simulation Parameters
The simulations include the following permutations:
- Progressive, Fair, Lenient Group, Oprah, and Single Strikes
- A variety of strikes thresholds for exiting the tournament
- Attendance including every value between 10 and 150 players
For each configuration, 5000 full tournaments were simulated, and average results were calculated across that configuration. The results include:
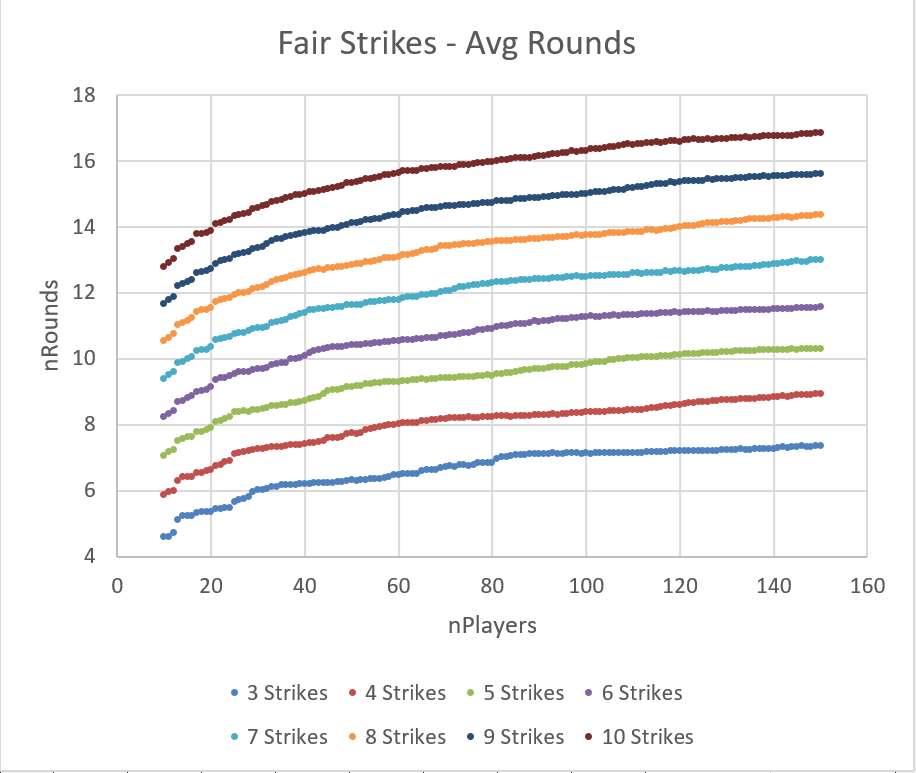
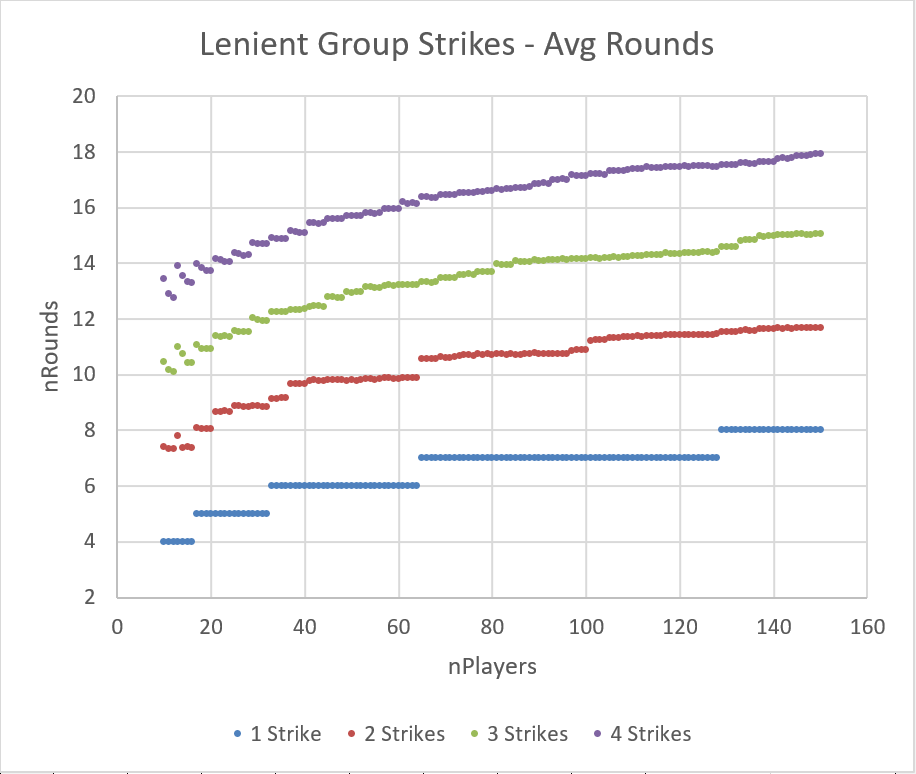
- Average tournament length (in rounds)
- Average tournament duration (in a kind of pseudo-time)
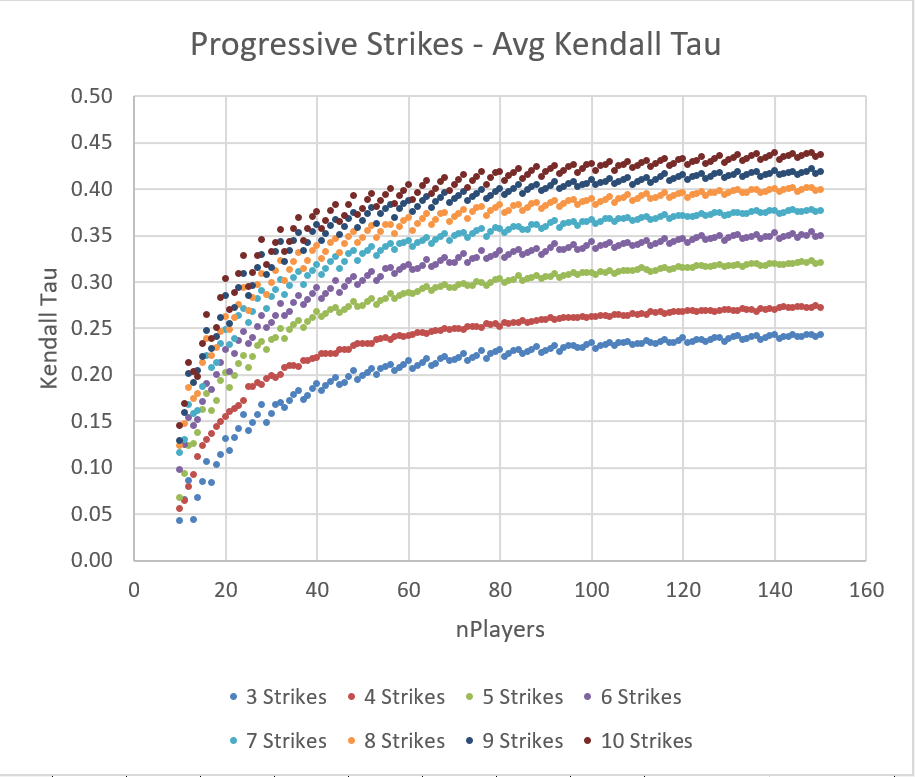
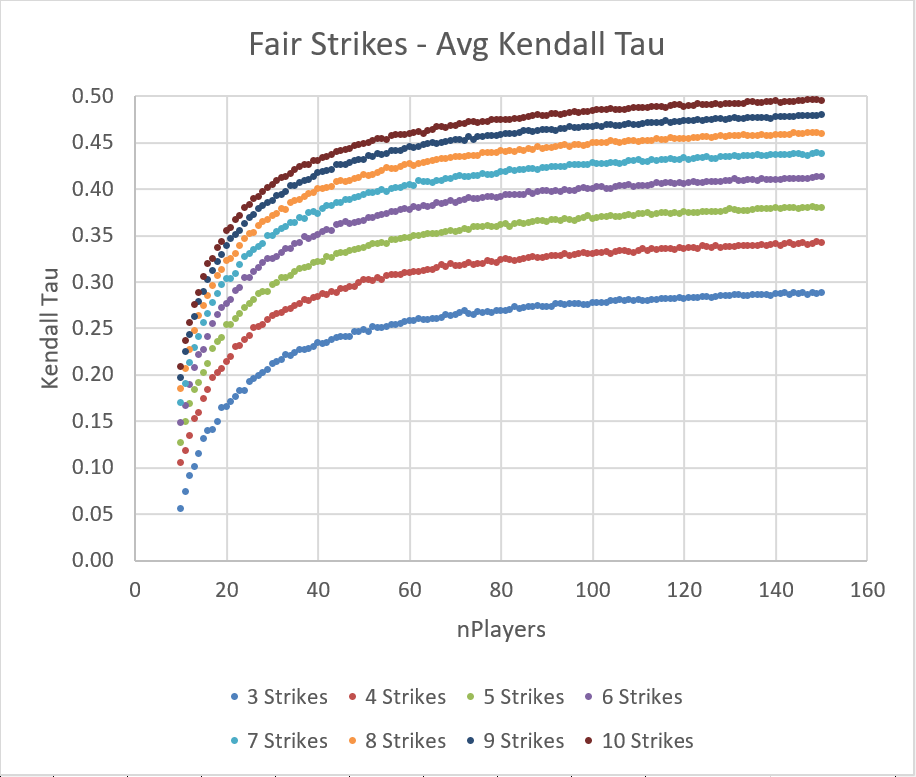
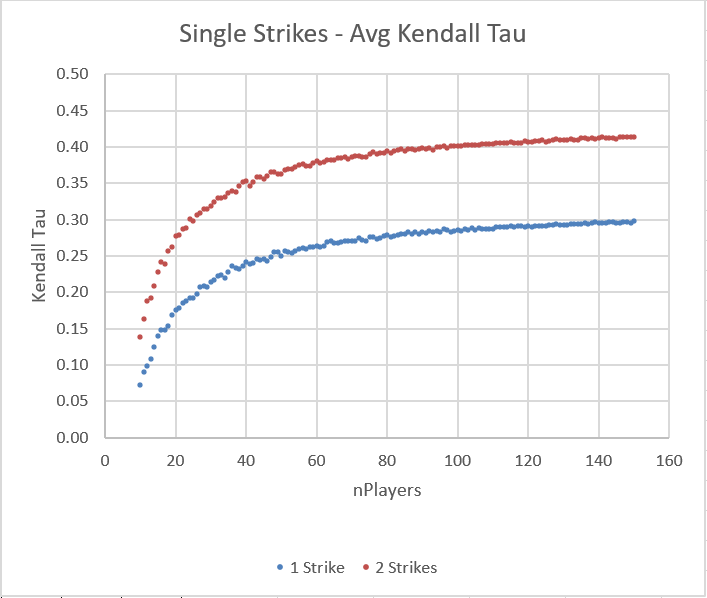
- Average Kendall tau (a statistical measure of how well the tournament sorts players by intrinsic skill) - if the players were perfectly sorted, this would be 1.0, and if they were randomly sorted, this would be close to zero.
Results
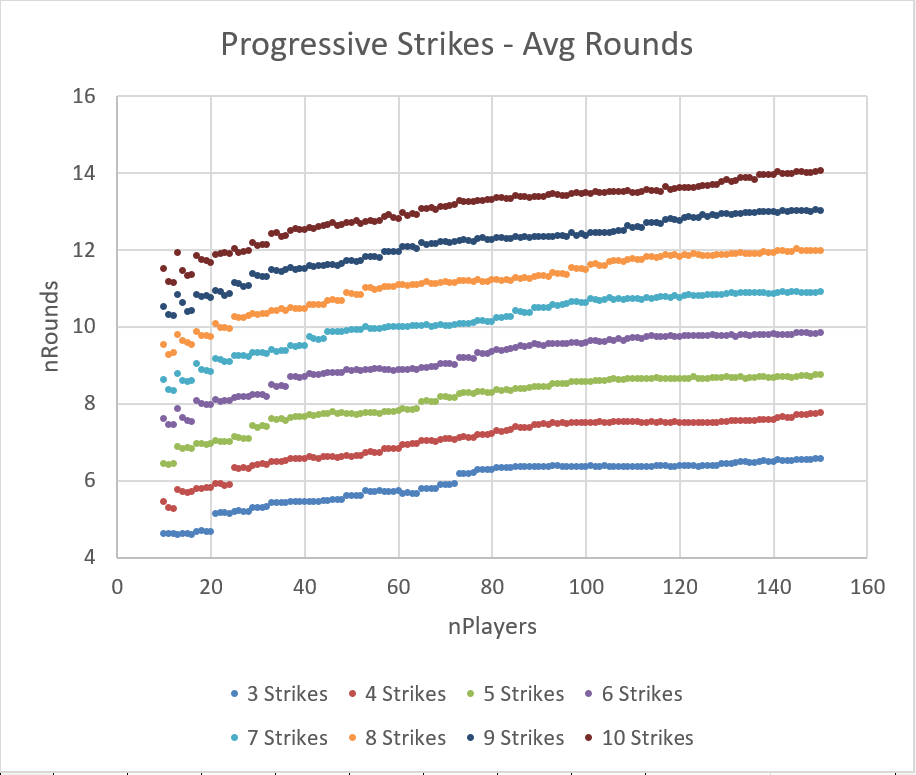
Progressive Strikes
Fair Strikes
Lenient Group Strikes
Oprah Strikes
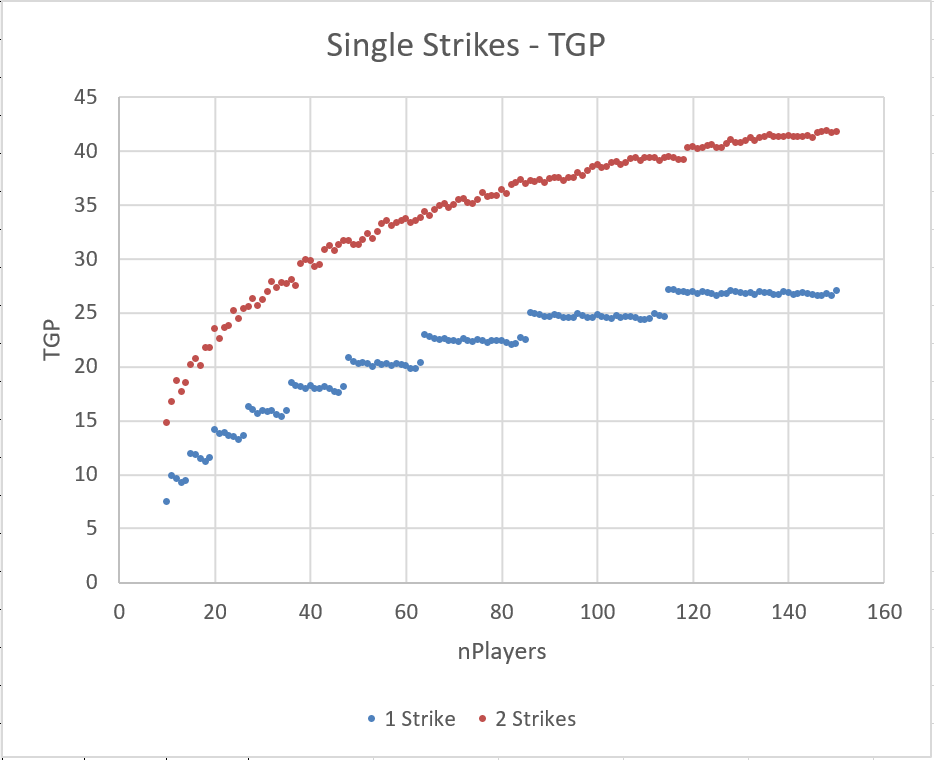
Single Strikes
Results, Narrowed
Many of these configurations are unlikely to be selected by a tournament organizer. For example, few tournament directors would choose 2 Fair Strikes. Therefore, we can narrow the scope to a few reasonable choices for the purposes of comparison:
- 10 Progressive Strikes
- 8 Fair Strikes
- 3 Lenient Group Strikes
- 6 Oprah Strikes
- 1 Single Strike
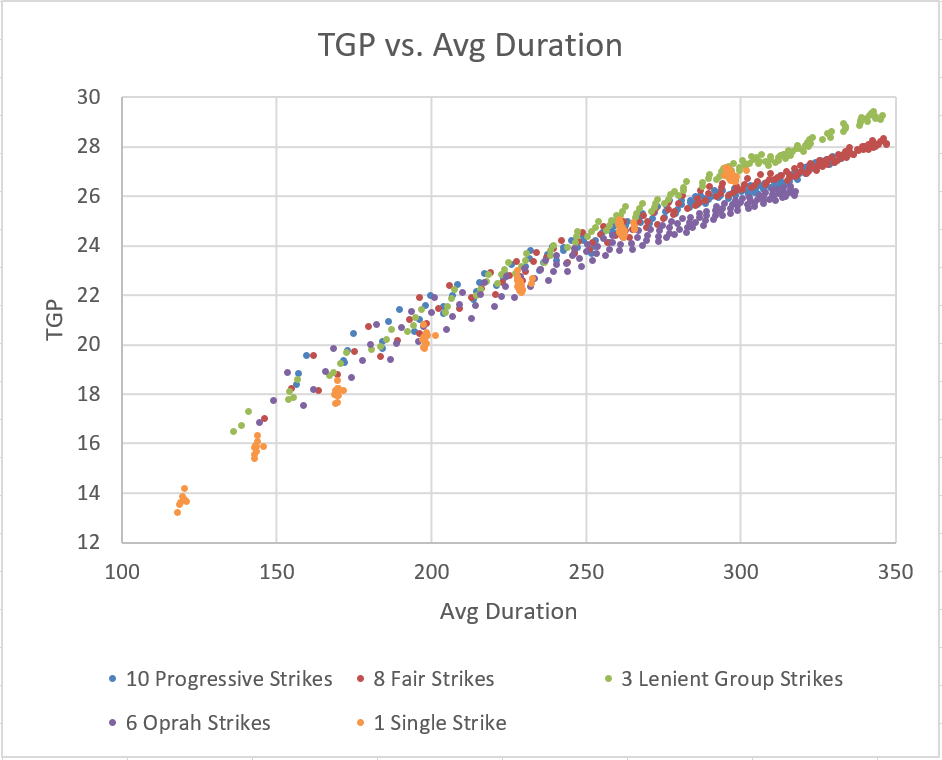
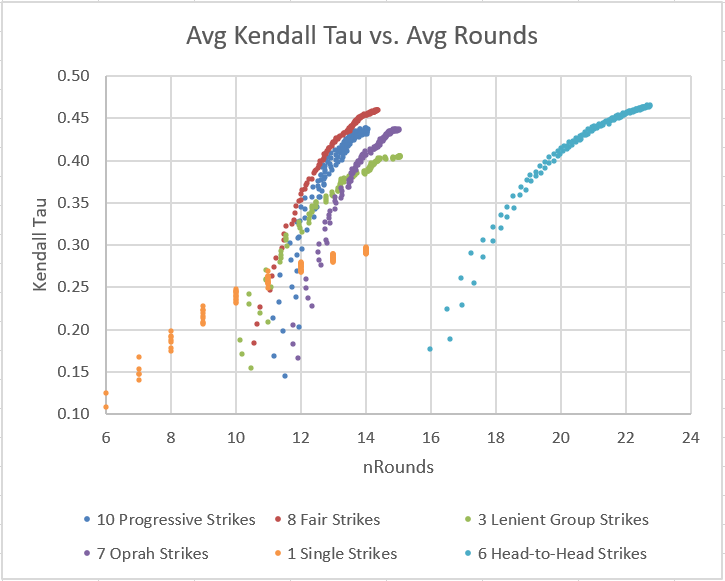
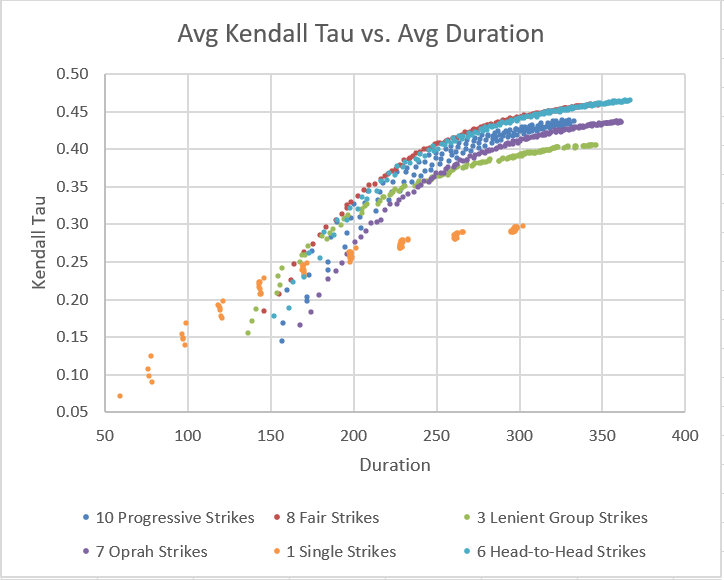
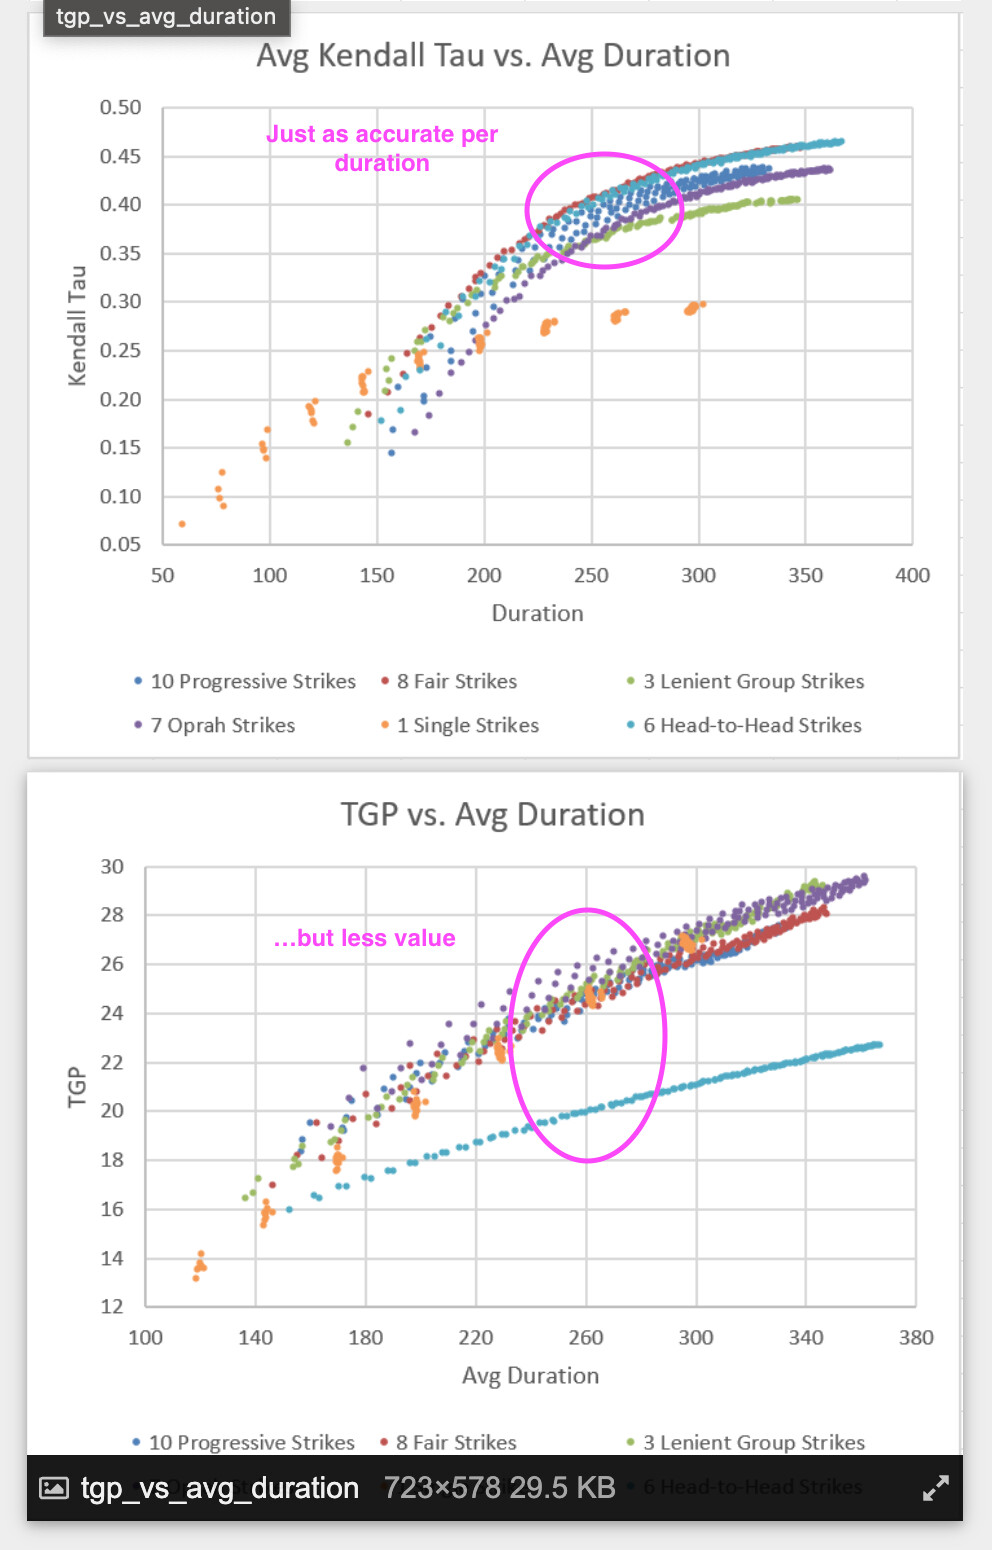
We know a tournament with more rounds will do a better job of sorting players by intrinsic skill (therefore higher Kendall tau), so it’s interesting to plot average Kendall tau vs. average number of rounds, for all values of attendance:
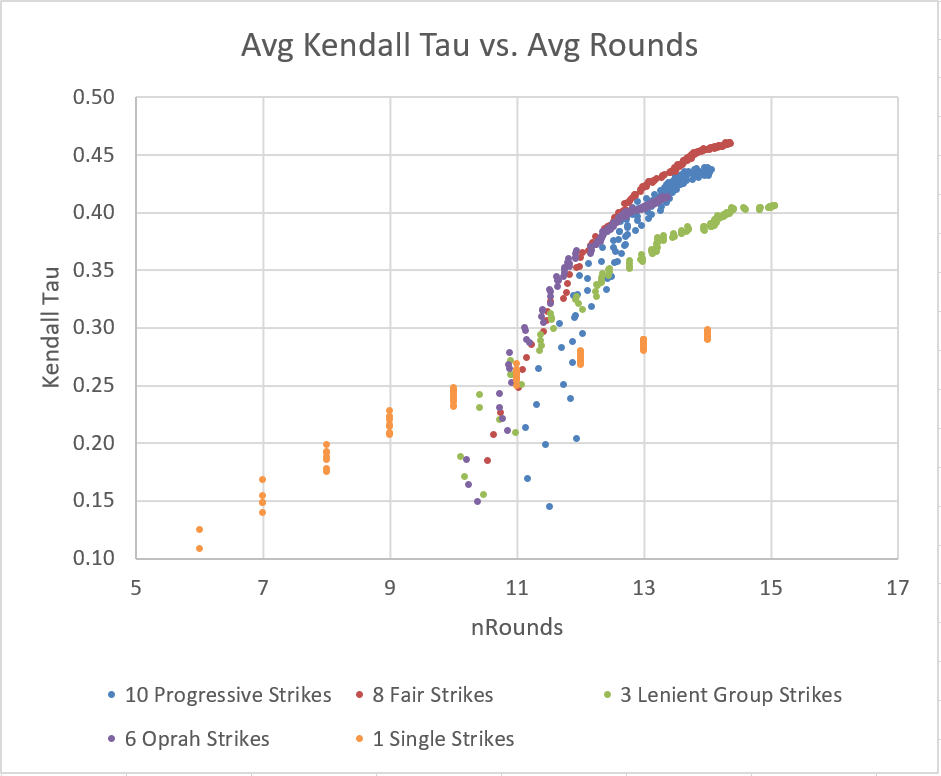
We can see that 8 Fair Strikes pulls into the lead as the most ‘efficient’ way to sort a large number of players by skill. For small numbers of players, the data is more chaotic, but 6 Oprah Strikes has a slight advantage. Two other formats (10 Progressive Strikes and 3 Lenient Group Strikes) produce rankings which are a bit more random, and therefore have a lower average Kendall tau value. 1 Single Strike is by far the least predictable format.
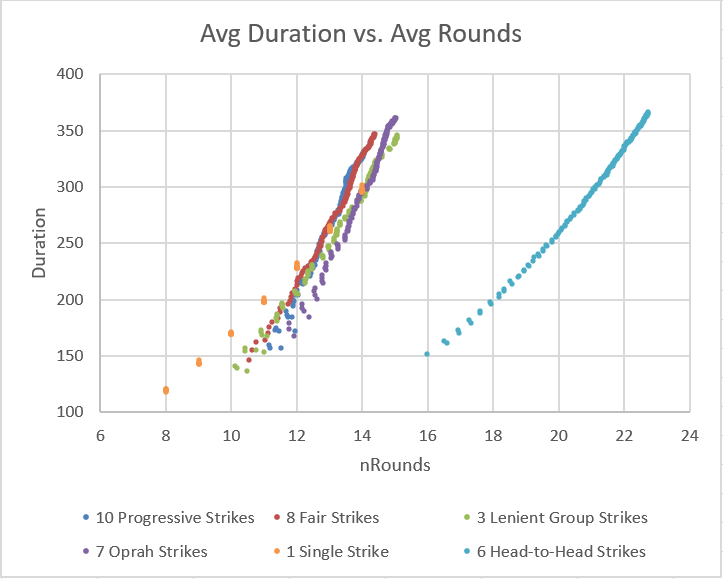
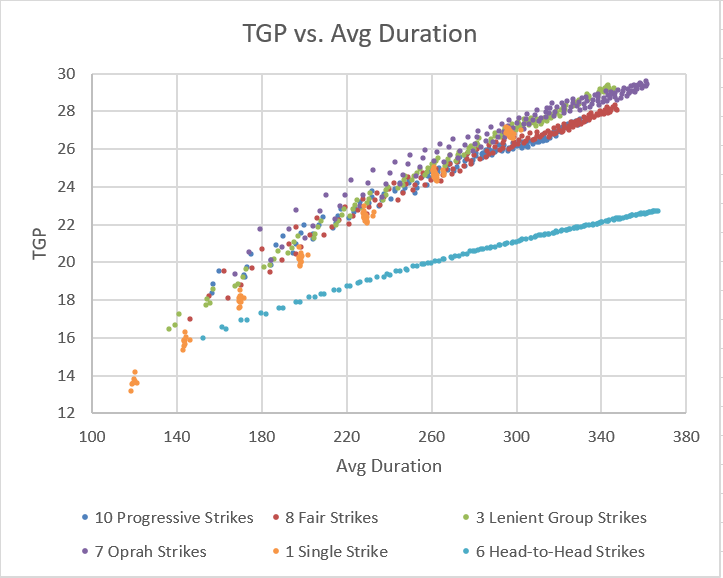
It’s also interesting to consider the duration of a tournament. Because of the lack of tiebreakers, strikes tournaments are already more time-efficient than many other formats. The code estimates the duration of each round as the highest sum of game scores across all groups. When using Swiss groupings, it is likely that top players will encounter each other repeatedly, leading to long game duration in the top groups. The top group could easily take 3 times longer than the bottom group to finish their game. Some amount of waiting is inevitable, but we can still compare formats:
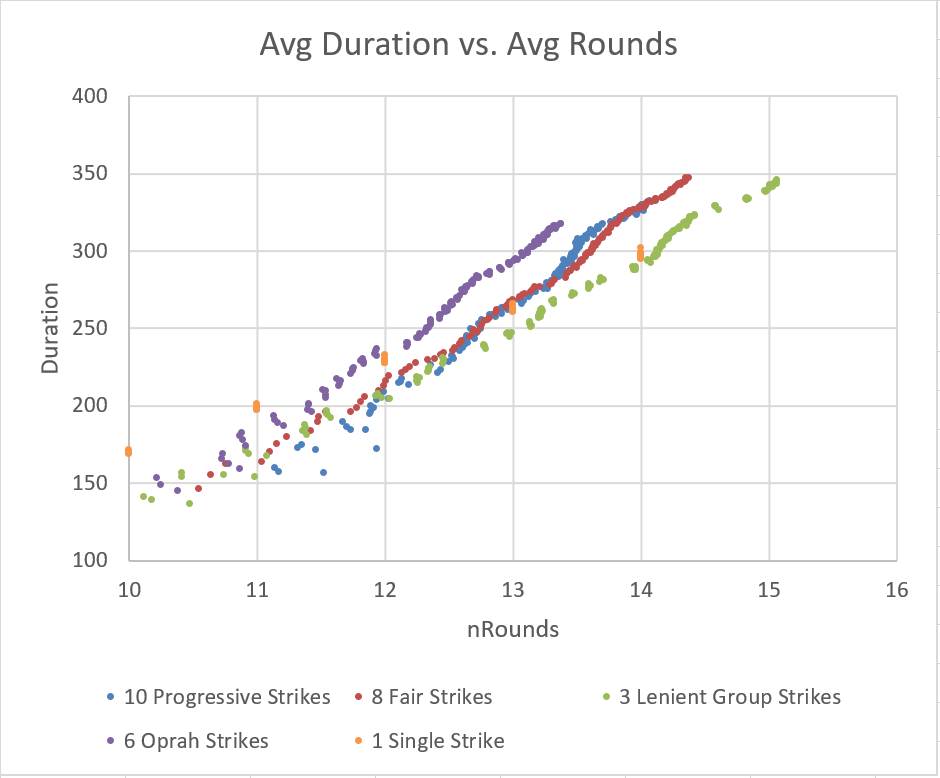
The results are fairly linear - duration is a roughly linear function of number of rounds, which would seem to agree with reality.
Variance
So far, the results presented include only average values across 5000 tournaments of each configuration. Let us consider the possible distribution of outcomes for the previously described popular tournament configurations:
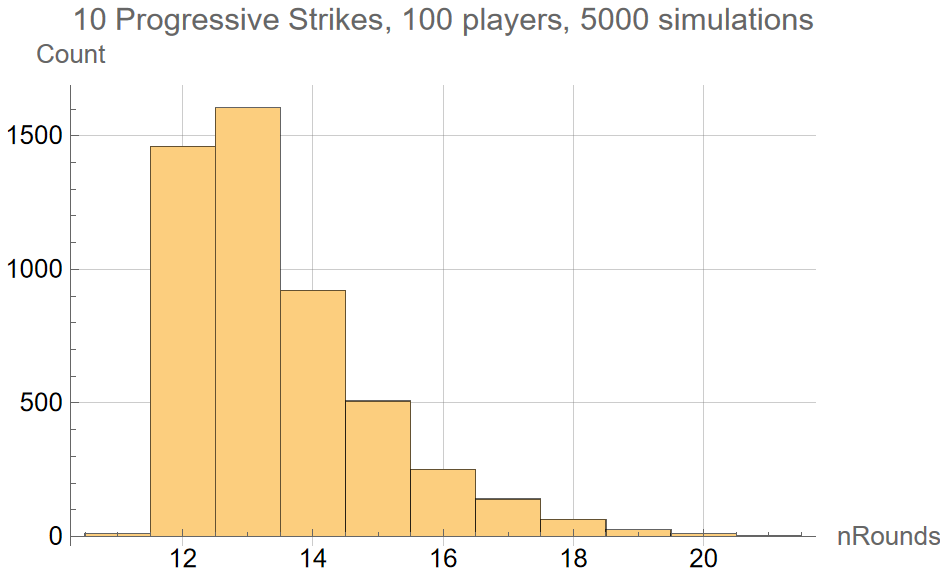
If 100 players play a 10 Progressive Strikes tournament, the duration will be about ~13.48 rounds on average. But there is considerable spread in the distribution. Here is the distribution after simulating 5000 tournaments:
- 11 rounds: 11 tournaments
- 12 rounds: 1461 tournaments
- 13 rounds: 1605 tournaments
- 14 rounds: 922 tournaments
- 15 rounds: 507 tournaments
- 16 rounds: 251 tournaments
- 17 rounds: 140 tournaments
- 18 rounds: 64 tournaments
- 19 rounds: 25 tournaments
- 20 rounds: 11 tournaments
- 21 rounds: 3 tournaments
The uncertainty in how many rounds 10 Progressive Strikes takes to conclude is very high, due to the long right tail of the distribution. This may not be a good choice if the tournament director wishes to get to bed at a reasonable time.
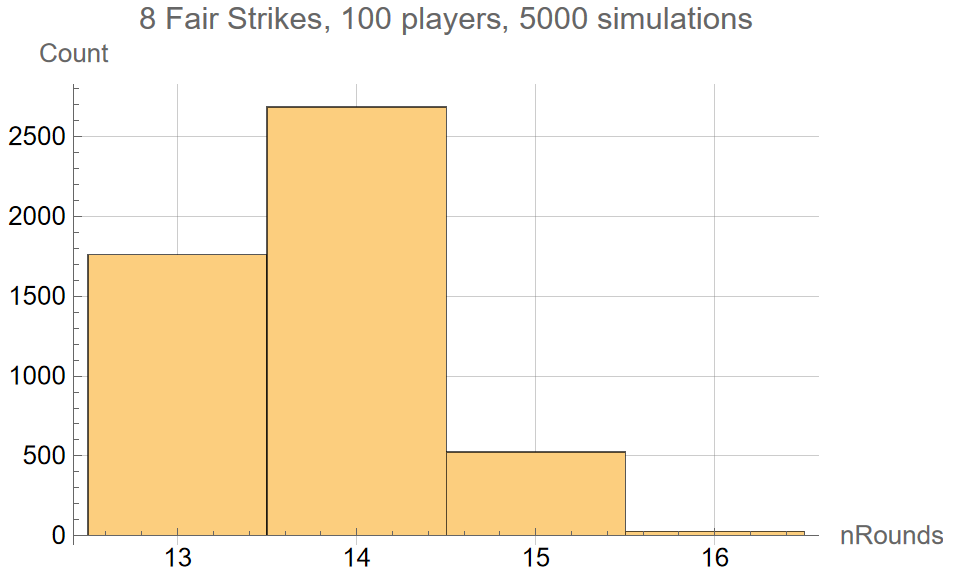
By comparison, 100 players playing an 8 Fair Strikes tournament is much more constrained, with a mean runtime of 13.76 rounds and the following distribution:
- 13 rounds: 1762 tournaments
- 14 rounds: 2687 tournaments
- 15 rounds: 524 tournaments
- 16 rounds: 27 tournaments
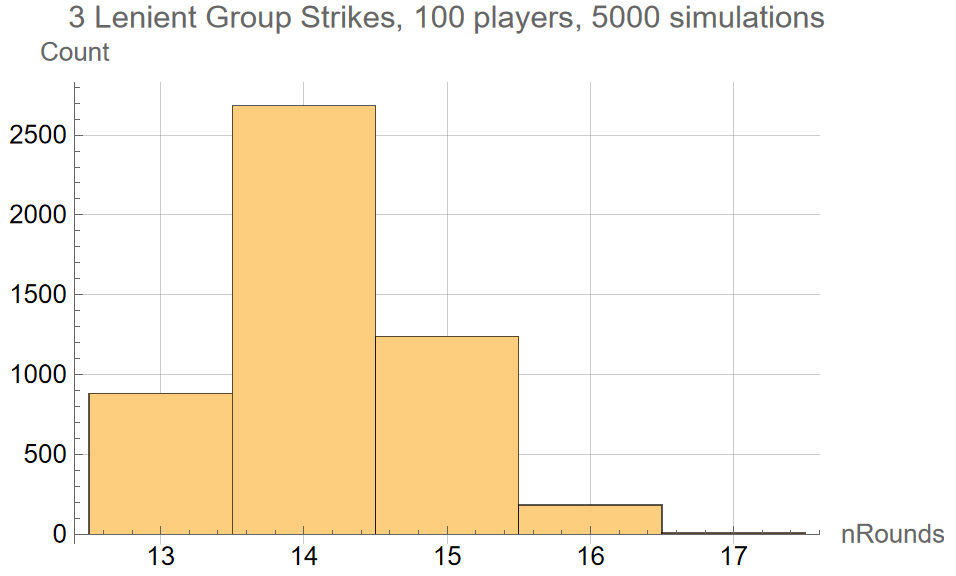
Likewise, 100 players playing a 3 Lenient Group Strikes tournament also has a fairly narrow distribution around its mean of 14.15 rounds:
- 13 rounds: 882 tournaments
- 14 rounds: 2685 tournaments
- 15 rounds: 1240 tournaments
- 16 rounds: 184 tournaments
- 17 rounds: 9 tournaments
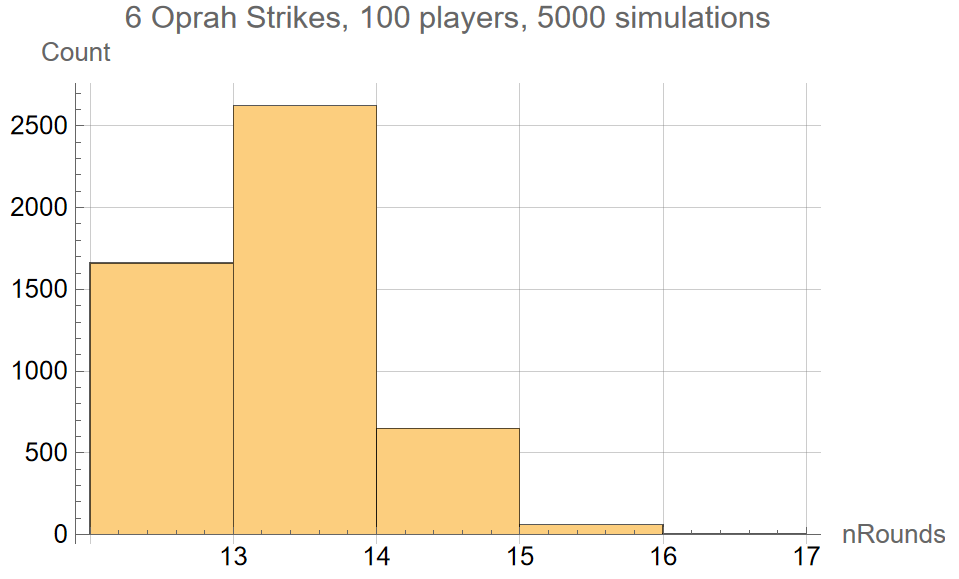
100 players playing a 6 Oprah Strikes tournament also has a fairly narrow distribution around its mean of 12.82 rounds:
- 12 rounds: 1662 tournaments
- 13 rounds: 2623 tournaments
- 14 rounds: 649 tournaments
- 15 rounds: 60 tournaments
- 16 rounds: 6 tournaments
There is no variance in the number of rounds for a 1 Single Strike tournament; it is deterministic. 100 players takes 13 rounds to conclude.
This data is shown in the histogram plots below:
Other Topics of Interest
Suppose we wish to know whether Swiss groupings or random groupings will have the shorter runtime. We can answer this in an approximate way by comparing histograms of the same tournament configuration with the two types of groupings.
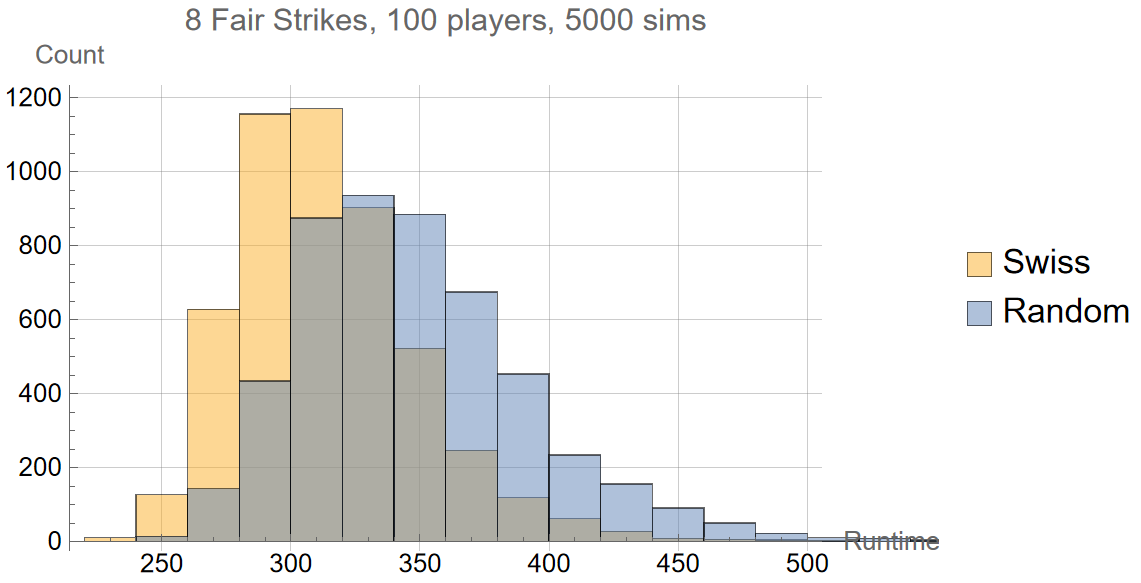
While Swiss groupings make each round take longer (due to the best players being concentrated at the top of the list), its reduction of the number of rounds outweighs this effect. Swiss groupings shorten the average runtime of an 8 Fair Strikes tournament by about 10%, from ~348 to ~314 time units.
What effect do Swiss pairings have on the ability of the tournament to sort the players by skill? Using the average Kendall tau parameter, we can see that Swiss pairings decrease sorting efficiency, but only very slightly. Swiss pairings reduce the average Kendall tau value from ~0.458 to ~0.449, a mere 2% reduction.
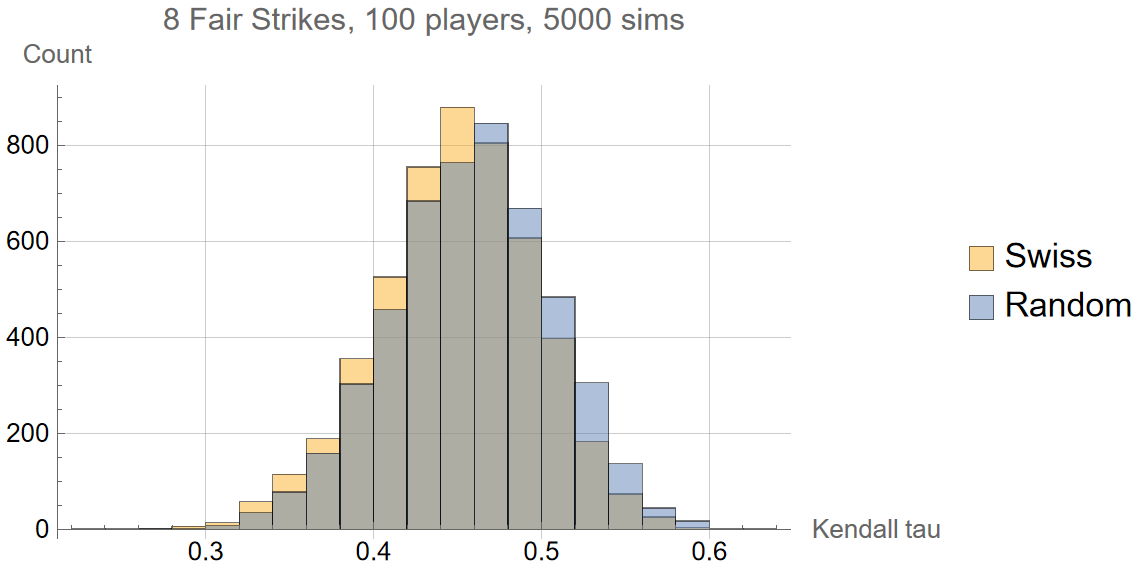
It seems reasonable to conclude that there is little downside to using Swiss pairings, and considerable upside for a tournament schedule.
Python Code
import math
import numpy as np
from operator import add
from scipy import stats
import csv


# USER-DEFINED PARAMETERS
SIM_TYPE = "Monte Carlo"    # "Monte Carlo" = average results for all permutations of N_PLAYERS and N_STRIKES
                            # "Histogram" = all results for N_PLAYERS_MIN and N_STRIKES_MIN
FORMAT = "Progressive Strikes"      # Progressive Strikes   [0,1,2,3]
                                    # Fair Strikes          [0,1,1,2]
                                    # Oprah Strikes         [0,1,1,1]
                                    # Lenient Group Strikes [0,0,1,1]
                                    # Single Strikes        [0,0,0,1]
N_PER_GAME = 4          # nominal number of players on each game (player count permitting)
SWISS = True            # True = Swiss groupings, False = random groupings
N_STRIKES_MIN = 3       # lowest strikes threshold for elimination (iterates from MIN to MAX)
N_STRIKES_MAX = 10      # highest strikes threshold for elimination
N_PLAYERS_MIN = 10      # lowest number of players in tournament (iterates from MIN to MAX)
N_PLAYERS_MAX = 150     # highest number of players in tournament
N_RUNS = 5000           # number of tournaments to simulate for each format and player count (higher = better statistics)
SKILL_SCATTER = 0.25    # second parameter of lognormal distribution of player skill
SCORE_SCATTER = 0.45    # second parameter of lognormal distribution of game score
RAND_SEED = 42          # starting seed for random number generator


# a player in a strikes-based tournament
class Player(object):
    def __init__(self, ID):
        self.ID = ID
        self.skill = rand.lognormal(0, SKILL_SCATTER)
        self.games = []
        self.strikes = 0
        self.bounties = 0

    # generate a game score
    def gameScore(self):
        return rand.lognormal(self.skill, SCORE_SCATTER)

    # store a game in memory
    def recordGame(self, game):
        self.games.append(game)

    # receive strikes & add to total
    def addStrikes(self, strikesGiven):
        self.strikes += strikesGiven

    # capture bounties & add to total
    def addBounties(self, bountiesCaptured):
        self.bounties += bountiesCaptured

# a strikes-based tournament
class Tournament(object):
    def __init__(self, nPlayers, nPerGame, format, nStrikes):
        self.nPlayers = nPlayers
        self.nPerGame = nPerGame
        self.format = format
        self.nStrikes = nStrikes
        self.players = []
        self.eliminatedPlayers = []
        self.groups = []
        self.numInRound = []
        self.roundDuration = 0
        self.totalDuration = 0
        self.nRounds = 0
        self.suddenDeath = False
        self.tau = 0
        self.tgpGameCounts = [0 for i in range(nPerGame - 1)]   # counts of m-player games played in tournament, where m = 2 to nPerGame

    # initialize list of players
    def initPlayers(self, n):
        self.players = [Player(i) for i in range(n)]

    # shuffle player order
    def shufflePlayers(self):
        rand.shuffle(self.players)

    # sort remaining players by strikes (stable sort)
    def sortByStrikes(self):
        self.players.sort(key=lambda p : p.strikes)

    # partition players into groups of at most n
    def partitionPlayers(self, n):
        if len(self.players) <= n:   # if all players fit in one group
            self.groups.append(self.players)
            self.players = []
        while len(self.players) > math.lcm(n, n-1): # while many players remain, group them n at a time
            self.groups.append(self.players[:n])
            self.players = self.players[n:]
        potentialPartitions = [i for i in [*partitions(len(self.players))] if max(i) <= n]
        potentialPartitions.sort(key = lambda x : min(x))
        chosenPartition = potentialPartitions[-1]   # choose partition with largest minimum group size
        for i in sorted(chosenPartition, reverse=True):
            self.groups.append(self.players[:i])
            self.players = self.players[i:]
        for g in self.groups:
            self.tgpGameCounts[len(g) - 2] += 1     # add number of 2-, 3-, 4-player game counts to tournament totals

    # each group plays their game
    def runGames(self):
        self.roundDuration = 0
        for g in self.groups:
            IDs = [p.ID for p in g]
            scores = [p.gameScore() for p in g]
            self.roundDuration = max(self.roundDuration, sum(scores))   # round duration is equal to the largest sum of players' scores on a game
            sortedScores = sorted(scores, reverse=True)
            ranks = [positions(sortedScores, lambda x : x == s)[0] for s in scores]
            strikesGiven = strikesGen(self.format, ranks)   # determine strikes given to each player
            for i in range(len(g)):
                g[i].addStrikes(strikesGiven[i])    # assign strikes
            for p in g:
                p.games.append(IDs) # record player IDs
            nElim = len([1 for p in g if p.strikes >= self.nStrikes])   # number of players in group who are eliminated
            iWin = positions(ranks, lambda x : x == 0)                  # indices of group winners
            if nElim > 0:
                g[iWin[0]].addBounties(nElim)                           # winner collects all bounties

    # remove eliminated players & return other players to main pool
    def cleanup(self):
        self.players = [p for g in self.groups for p in g if p.strikes < self.nStrikes]
        self.eliminatedPlayers.append(sorted([p for g in self.groups for p in g if p.strikes >= self.nStrikes], key = lambda p : p.strikes))
        self.groups = []

    # run rounds until one person remains
    def runTourney(self):
        self.initPlayers(self.nPlayers)
        while len(self.players) > 1:
            self.nRounds += 1
            self.numInRound.append(len(self.players))
            self.shufflePlayers()   # randomize player order
            if SWISS:
                self.sortByStrikes()
            self.partitionPlayers(self.nPerGame)
            # print("ROUND", self.nRounds, ":", len(self.players), "remaining.  Top group:", [p.strikes for p in self.groups[0]])
            self.runGames()
            self.cleanup()
            self.totalDuration += self.roundDuration
        self.kendallTau()

    # compute Kendall's tau, a measure of how well the tournament ranked the players by intrinsic skill
    def kendallTau(self):
        rankedPlayers = [p for round in self.eliminatedPlayers for p in round]
        rankedPlayers.insert(0, self.players[0])
        ranks = range(len(rankedPlayers))
        skills = [p.skill for p in rankedPlayers]
        tau, p_value = stats.kendalltau(ranks, skills)
        self.tau = tau

    # report tournament results
    def report(self):
        print("After", self.nRounds, "rounds")
        print("The winner is: Player", self.players[0].ID, "with", self.players[0].strikes, "strikes")
        print("Winner's games played:")
        for g in self.players[0].games:
            print(g)

# return positions of list items matching a predicate
def positions(list, predicate):
    return [i for i, v in enumerate(list) if predicate(v)]

# signum function
def sign(x):
    if x > 0:
        return 1
    elif x < 0:
        return -1
    else:
        return 0

# generator for integer partitions
def partitions(n, I=1):
    yield (n,)
    for i in range(I, n//2 + 1):
        for p in partitions(n-i, i):
            yield (i,) + p

# determine strikes assigned to each rank for a game result
def strikesGen(format, ranks):
    n = len(ranks)
    strikes = []
    if format == "Progressive Strikes":
        return ranks    # strikes equal ranks; [0, 1, 2, 3]
    elif format == "Fair Strikes":
        for i in range(n):
            strikes.append(sign(ranks[i]) + (1 - sign(n - 1 - ranks[i])))   # strikes = [0, 1, 1, 2]
    elif format == "Oprah Strikes":
        for i in range(n):
            strikes.append(sign(ranks[i]))  # all but winner get a strike; [0, 1, 1, 1]
    elif format == "Lenient Group Strikes":
        s = math.ceil(n/2)
        for i in range(n):
            if ranks[i] >= s:
                strikes.append(1)   # worse half of players get a strike, lenient when n=odd [0, 0, 1, 1]
            else:
                strikes.append(0)
    elif format == "Single Strikes":
        for i in range(n):
            strikes.append(math.floor(ranks[i]/(n - 1)))   # lowest score gets a strike; [0, 0, 0, 1]
    else:
        for i in range(n):
            strikes.append(1)   # give everyone a strike
    return strikes

# return stats on tourney
def tourneyStats(nPlayers, nPerGame, format, nStrikes, nRuns):
    roundsData = []
    durationData = []
    tauData = []
    bountyData = []
    tgpGameCounts = [0 for i in range(nPerGame - 1)]
    for i in range(nRuns):
        tourney = Tournament(nPlayers, nPerGame, format, nStrikes)
        tourney.runTourney()
        roundsData.append(tourney.nRounds)
        durationData.append(tourney.totalDuration)
        tauData.append(tourney.tau)
        bountyData.append(tourney.players[0].bounties)
        tgpGameCounts = list(map(add, tgpGameCounts, tourney.tgpGameCounts))
    avgRounds = np.mean(roundsData)
    avgDuration = np.mean(durationData)
    avgTau = np.mean(tauData)                           # average Kendall tau of rankings
    avgBounties = np.mean(bountyData)                   # average bounties collected by winning player
    tgpMultipliers = [0.5*i + 1 for i in range(nPerGame - 1)]   # TGP multipliers for 2-, 3-, 4-player games, etc.
    tgpNetMultiplier = sum([x*y for x, y in zip(tgpGameCounts, tgpMultipliers)]) / sum(tgpGameCounts)    # overall multiplier for tournament config
    tgpFinal = avgRounds*tgpNetMultiplier
    return (avgRounds, avgDuration, avgTau, avgBounties, tgpFinal)

# return histogram on tourney
def tourneyHist(nPlayers, nPerGame, format, nStrikes, nRuns):
    roundsData = []
    durationData = []
    tauData = []
    bountyData = []
    for i in range(nRuns):
        tourney = Tournament(nPlayers, nPerGame, format, nStrikes)
        tourney.runTourney()
        roundsData.append(tourney.nRounds)
        durationData.append(tourney.totalDuration)
        tauData.append(tourney.tau)
        bountyData.append(tourney.players[0].bounties)
    return (roundsData, durationData, tauData, bountyData)


### -------- SCRIPT -------- ###

# initialize random generator
rand = np.random.RandomState(RAND_SEED)

# Monte Carlo statistics for many tournament configurations
if SIM_TYPE == "Monte Carlo":
    nStrikes = range(N_STRIKES_MIN, N_STRIKES_MAX + 1)
    nPlayers = range(N_PLAYERS_MIN, N_PLAYERS_MAX + 1)
    iMax = len(nStrikes)
    jMax = len(nPlayers)
    for i in range(iMax):
        print("starting on", nStrikes[i], "strikes")
        fileID = str(nStrikes[i]).zfill(2)
        filename = FORMAT + " " + fileID + ".txt"
        f = open(filename, 'w')
        writer = csv.writer(f)
        for j in range(jMax):
            print(nPlayers[j], "players")
            avgRounds, avgDuration, avgTau, avgBounties, tgpValue = tourneyStats(nPlayers[j], N_PER_GAME, FORMAT, nStrikes[i], N_RUNS)
            writer.writerow([avgRounds, avgDuration, avgTau, avgBounties, tgpValue])
        f.close()

# complete data for a single tournament configuration (useful for making histograms)
if SIM_TYPE == "Histogram":
    roundsData, durationData, tauData, bountyData = tourneyHist(N_PLAYERS_MIN, N_PER_GAME, FORMAT, N_STRIKES_MIN, N_RUNS)
    filename = FORMAT + " " + str(N_STRIKES_MIN).zfill(2) + " " + str(N_PLAYERS_MIN).zfill(2) + " histogram.txt"
    f = open(filename, 'w')
    writer = csv.writer(f)
    for i in range(len(roundsData)):
        writer.writerow([roundsData[i], durationData[i], tauData[i], bountyData[i]])
    f.close()