Forecasting IFPA Tournament Growth: Is There a Fee Effect?

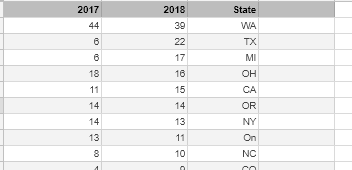
Recently, @pinwizj and @PinballProfile posted on facebook and pinside the number of calendar event submissions for January 2018…

The numbers show improvement in the number of submitted January events in 2018 relative to number of completed events in January 2017, suggesting that the number of IFPA events grew despite the new endorsement fee. However, many commenters quickly pointed out several issues with making this comparison. For one, it does not take into account year over year growth trajectory. The number of events has been increasing for years, so an increase from 2017 to 2018 is not surprising. The more interesting question is whether the growth seen from 2017 to 2018 is bigger or smaller than would be expected. A second issue pointed out is that the comparison does not take into account the fact that the state championship occurs in January this year, whereas it occurred in February in previous years. Thus 2018’s January numbers are going to be a bit padded.

To address these issues, I applied a forecast model to the IFPA tournament data. The forecast model attempts to account for several effects common in time series data, such as annual growth, seasonal effects, and weekly effects. Importantly, it also can account for special days (Christmas,New Year, etc.) which uniquely influence the data. In this case, I directed the model to account for the SCS finals, which is historically the biggest tournament day of the year in terms of number of events. Below you can see the model make predictions on the number of events held each day, from 2013 to 2018.

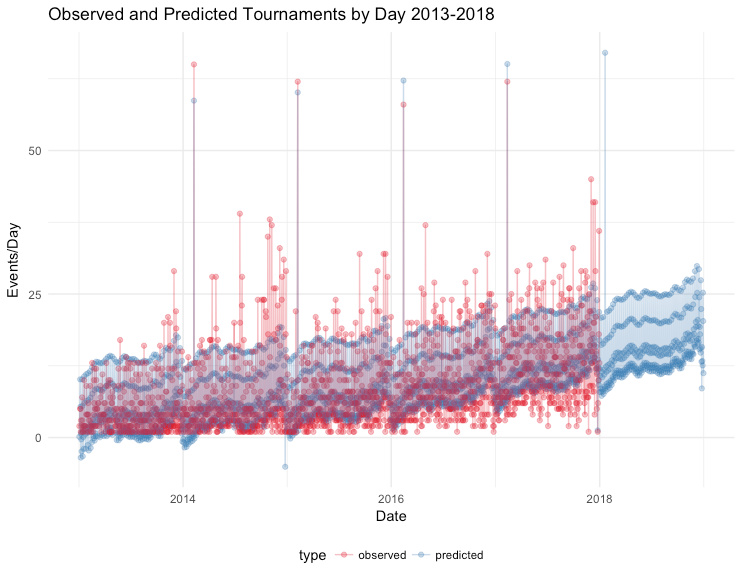
There are several interesting effects that the model picked up on.

  • The steady increase over time indicates annual growth in the number of tournaments from year to year.
  • The “wave” pattern that occurs throughout each year indicates seasonality. There is a rapid dip at the beginning of each year, a recovery around spring, another slump during summer, then a rapid increase in the number of events at the end of the year. Many of these fluctuations can be attributed to the SCS– the end of year run can be attributed to last chance qualifying events, and the dip at the beginning of the year is a correction to the norm.
  • The multiple “bands” that appear are the result of “weekly effects” – far more tournaments are held on saturday and sunday than other days of the week. (Interestingly, Tuesday is the most common day for weekday events)
  • The model sometimes does dumb things like predict negative tournaments.
  • Finally, on one special day every year, there is a huge spike in tournaments. This is SCS finals day.

While the actual data is rather noisy, the forecast plot smooths this noise out. It can’t predict random swings and fluctuations in the data, but it gives a nice estimate that is “in the ball park”.

In the figure below we break down the numbers according to month.

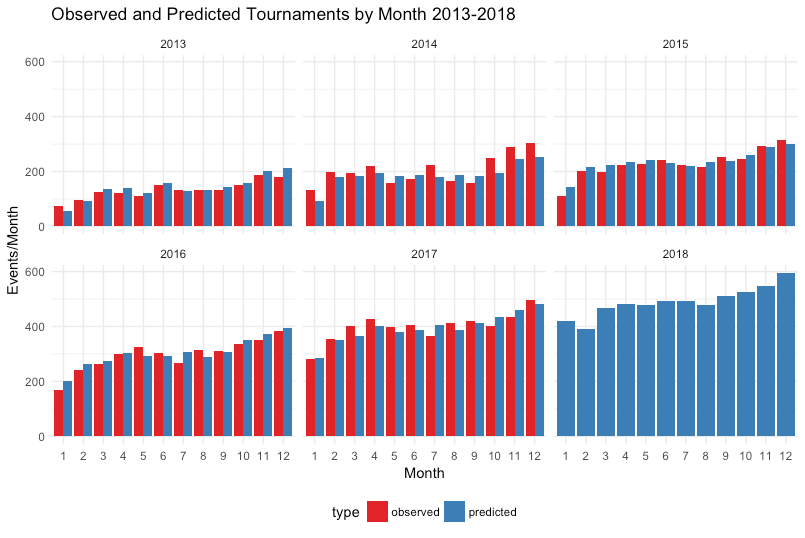
When expressed as monthly sums, we see that the forecast model does an excellent job at predicting the number of tournaments to be held each month.

The really interesting/relevant stuff is in the 2018 predictions:

  • The model predicted about 421 tournaments in January 2018. Thus, when accounting for year over year growth, and the SCS effect, the actual number of events that were submitted to the IFPA calender (373) falls a bit shy of the predicted number. Keep in mind, the model doesn’t know anything about the WPPR fee, it’s just assuming business as usual.
  • The model predicts that a slump will occur in February 2018, likely due to there not being a SCS finals that month.
  • It is likely that we will crack 500 events in a single month this year. (!!!)

Overall, the analysis answers some of the issues addressed earlier. When the year-to-year growth and SCS finals effects are accounted for, we see that the growth observed thus far in January 2018 is shy of what would be expected. However, if this is the result of a negative WPPR fee effect, it appears to be modest at best. Of course, it is important to point out that the 373 events are only on the calendar– if many of these events are cancelled or the directors fail to submit the results, then the IFPA will fall well short of the projected forecast. At the end of the day, the most important part is that we are continuing to see positive growth.

I’ll update this post in a couple months to see how well these predictions play out!

19 Likes

thank you so much for the data!!
is there anyway to map the average size of events? that could be a key factor in determining growth.
i predict that we will see a greater number of events, which have smaller turnouts (more local weeklies and one offs).

really excited to see how this year develops

Is this data strictly from North America where the fees have been introduced, or is this worldwide? Either way it’s cool to see! Thanks for putting this together.

2017 - 23.6 players per event
2016 - 25.5 players per event
2015 - 27.0 players per event
2014 - 25.2 players per event
2013 - 26.9 players per event

I suspect the 50% participation requirement is a major factor in the drop in players per event in 2017. Not necessarily fewer players, just fewer included in the results.

5 Likes

I kind of agree on that logic; the variable-percentage system definitely impacted every league and tournament because the large groups have to omit everyone who doesn’t have full participation. Reverting to a flat 50% should set the baseline back to approx. 2016 figures.

304 are for North America. Here is the top ten:

image

Brian

1 Like

I think there’s soooo many variables that hit the average, it’s tough to pin it on only one.

When new competitive scenes emerge they often start small. There’s often a motivation to get players rated so places are running those small events frequently.

Just as one additional data point, the average for “all events ever” is 25.7 players per event.

2 Likes

I know you said it is correcting for the SCS, but did it also account for the number of events that would be held on a typical Saturday in January that won’t be held because of an SCS conflict? I doubt the number of events held on that Saturday would be enough to bridge the gap between the actual and predicted (48), but it is probably still significant. If it isn’t accounting for that, what is the typical number of events for the third Saturday of January?

P.S. Love the analysis!

2 Likes

It would be interesting to see a distribution plot based on the number of participants and then bin() it into groups of 5 as a way to supplement the information about averages. I’ve been meaning to get Tableau set up against the API and this thread gives me a reason to start diving into it again to play with the data.

So @pinwizj destroyed pinball - confirmed! :wink:

1 Like

I used all events world wide for this particular analysis.

Can you explain this a little more? Not sure I follow.

Whatever negative effect SCS day has on the # of tournaments, it is offset by a huge amount of tournaments that would not otherwise have occurred on that day. These effects are baked into the model, and you can see in the first figure that it tracks rather well on what actually happens on SCS day.

1 Like

Mmmmm data trends. Cool analysis thread

“Histogram” was the term I meant to use. Basically, group the number of participants of each individual event into “bins” of five so you can make a chart like the one below (excuse the random histogram picture I stole from Google). I’d assume we have some kind of long right-tail (lots of events with 10-30 people) followed up fewer and fewer events with 50, 60, 80, 100, ++ all the way until you hit 800 for Pinburgh.

I got that, I’m confused more about the “as a way to supplement the information about averages” part of the comment. What is the goal, to determine whether there has been a shift in the distribution of tournament sizes over the years?

Phil, also, for this analysis of tourney size (if you pursue it), I’m assuming that the data set is large enough that Average (Mean) is deemed an appropriate metric to use instead of Median? Pinburgh’s ~800 players would certainly skew a small data set, but having some 4,000+ events per year probably makes Mean equally useful. Correct?

Yes, that is what I think would be interesting to see to supplement the Average number. What shifted the average down between 2016 and 2017? Are we seeing fewer bigger events? More frequent smaller events? And as 2018 rolls on, what are we seeing in terms of per-event numbers if directors are choosing the “hybrid” method of allowing people to declare if they will pay to be included in submission.

There are more layers to this question than you probably intended. It is true that as the number of samples increases, the less of an issue outliers are. However, because we are plotting changes over years, and the overall number of samples are changing, it can affect our interpretation of the mean. For example, I’m not sure that the drop in mean tournament size over years mentioned before is really all that meaningful, and is probably just an artifact. In early years, there are fewer tournaments, so the mean is skewed by high attendance tournaments. Then as the number of overall tournaments increase, particularly with more low player tournaments, the mean gets dragged down. This will happen even if you use the median, btw. Does that make sense? See the last figure below, too

for @coreyhulse, here are your histograms…

It’s sort of hard to see what’s going on at this scale, but at the very least, you can see that the vast vast majority of tournaments are small in size (under 50 players).

Here is growth by tournament size

As you can see, there was growth in practically all tournament sizes. There was a drop off in the 100-200 bin though, that might account for some of the drop in the 2016-2017 mean tournament size. However, that was really only a loss of 12 tournaments… WARNING: I allowed the y axis scales to vary in this figure because if I didn’t, you wouldn’t be able to even see the 100-200, and 200+ bins because there are so few of them.

Below is a plot of the proportion of tournaments that fall into different bin sizes over the years.

Here, you can see that with increased growth, the overall number of low attendance tournaments continue grow relative to the high attendance ones. This is the effect I was speaking of at the beginning of this post – the influence the high attendance tournaments becomes less and less pronounced over the years, which can affect how you interpret year-to-year changes in the mean.

2 Likes