Hi folks. I thought I’d share something I’ve been working on recently.
I’ve been playing in the New England Pinball League for my first time this current season and wanted to try to see if I could use the data they have from the past few seasons on http://nepl.league.papa.org to rate players based on true head-to-head results. Currently, the IFPA rates players based on simulated head-to-head results.
The format of a New England Pinball League meet is the following:
Players are placed in a 4 or 3 player group. They play a total of 4 matches against all other members of their group. Each player receives a certain number of points based on their standing after the game is finished (usually 5-3-2-1).
If a player plays for all 8 weeks in a 4 player group, they potentially have 8 weeks * 12 head-to-head matches against individual players in a regular season for a total of 96 games. In Season 5 of the New England Pinball league, Mitch Curtis played 80 head-to-head games (4 player games counts as head to head against 3 opponents) and came out with a record of 55-25 on the season. Mitch also wound up in 1st place for the league. Based on the IFPA rating system, Mitch’s record is 67-0 where he defeated every opponent 1 time. Winning over 2/3rds of your games is a huge feat in most sports with considerably long seasons. Going undefeated over 67 straight games? Nearly impossible.
In the case of a league like SuperLeague, where playing a full month’s entry will guarantee you finish ahead of hundreds of players, the rating can become very skewed and artificially inflated. The skewing of rating is obvious because of the simulated victories. The inflation comes when a walk-in plays 1 game, is assigned a rating of 1200, and instantaneously loses to 300+ players when results are processed.
Of course, the task of finding the true rating of every player by taking every qualifying result, and every head to head result is very difficult. That’s why I’m just doing this for fun 
So, without further rambling, here are some numbers!
Google Sheets link to Season 5 NEPL with Elo rating
This is a very simple, no-frills implementation of Elo. To start, every player is assigned a rating of 1200. I use a constant of 30. Play ratings do not change over time and are only affected by results.
NEPL has 5 more seasons which I will be adding shortly. When they are up, I will add them to this forum post.
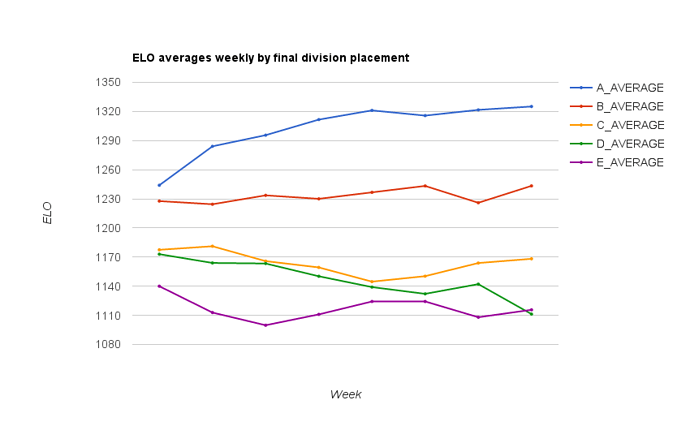
And here’s a chart!
This chart shows the average Elo of players each week based on which division they qualified in. Thought it was interesting to see how close the bottom 3 divisions were compared to the top 2.
On my short list for more analysis:
Rest of NEPL Seasons.
PPL Seasons (same format)
Pinburgh results (can’t get true head to head results, but can estimate expected win/loss every round.)
Would love to hear any comments, suggestions, and ideas!


 Kevin Martin wrote the version for PARS, which has the same formulas.
 ) until 1) I was sure the v2.0 software was stable, and 2) I finished some other more important tasks. But both of those concerns are well in the rear-view mirror, so I’ll look into doing this soon.