WPPR v6.1 sneak peek . . .

Hybrid completely fails if you do less than or greater than. 1 attempt per machine is “less than”. Unlimited attempts per machine is “greater than”. So this would have to be exactly 4X.

5 game restriction is only something for Certified/Certified+ events (similar to Card or Unlimited Best Game).

Attempts have nothing to do with the number of scores being included in the standings. It’s completely about the number of machines available.

Your example of 15 machines with 2 scores counted per machine is 60 attempts is correct. Your example of 15 machines with 1 score counted per machine is 60 attempts is correct. If you did 15 machines with THREE scores counted per machine . . . 60 attempts would be correct.

As for games malfunctioning and going down, being brought back in, etc . . . I don’t plan on busting someone’s balls over it. I would expect tournaments to start with the number of games they intend to use for the whole event. If something goes wrong and they end up being slightly over that 4X number due to this issue, it’ll be fine. We’ll deal with that on a case-by-case basis.

1 Like

If you have data on what qualifying would have looked like at everyone’s point-in-time of hitting that 4X level of attempts and where those players improved in those entries after that point, send it over!

Karl was nice enough to send me a data dump from Yegpin and Expo to play around with, and I saw plenty of people that improved their position quite a bit based on those games played that were beyond that 4X limit.

(This is all with the understanding that the data is flawed because perhaps someone like myself wouldn’t have played King of Diamonds 31 times in a row if I knew I only had 36 tickets in total to play with)

Awesome. Thank you. You’ve got my support for adding it to v6.1.

Pretty sure all the INDISC data is publicly available on never drains, as long as never drains was used anyway.

Cool story bro :slight_smile:

image

Ok, you win. Still feel like this might be a solution to a “problem” that is a perception problem more than an actual problem. Tournaments need pot monsters as much as they need one entry heros.

1 Like

Didn’t realize prize pools were so important that we should support them more than trying to have a more accurate representation of the skill of the players competing.

IMO this is more than a perception problem based on the actual data that I’m staring at right now. I’m happy to do the same analysis on past Best Game INDISC results once that data becomes available.

Regardless of the perception vs. reality debate, the question I’m trying to answer is theoretically related to judging skill. If I were to have you rank these three ways to measure skill in order, what order would you put them in?

  1. We each play a game one time
  2. We each play a game 4 times, taking our best score
  3. We each play a game as many times as we can afford to do so in the next 20 hours. In that time I played the game 8 times and you played the game 71 times.
2 Likes

Regardless of the perception vs. reality debate, the question I’m trying to answer is theoretically related to judging skill. If I were to have you rank these three ways to measure skill in order, what order would you put them in?

This question can be answered via simulation. You can do even better than ranking the formats, you can quantify how much better one is over the other. That can help you gauge how much to boost one format over another. I don’t really have the bandwidth to work on it unfortunately, but maybe @FuzzyChord would be interested in taking it on.

Now would max 4 attempts per game be allowed as well?

Would going under also be allowed say if allowed to have max 4 attempts per game then haveing one game go down and then have players ending up be capped just under X4

Also what about an last minute bonus game being added to the pool? That may put you just under say max attempts 60 over all then at the last minute have 16 games but to late to update the ticket sold for 60 max?

Or cases of tickets sold 60 attempts but only have 14 games out of 15 planed working for the event. With maybe an stand by game they don’t want to put in for the full event but held back as an spare.

Obviously #2 is the answer I find best but I think #3 is perfectly acceptable provided the numbers are closer to 7 and 12, which is what I would expect to see. If the wildly unusual number in your example is actually occurring at events based on the data you have (and isn’t one outlier), then I’m glad to support this change. Not that my support means anything one way or the other. :slight_smile:

I haven’t read every post in this thread, but I understand there are questions about how well different qualifying rules end up sorting players by skill.

I have some existing code which may help to answer these questions. It assumes players have an intrinsic skill, which is of course an oversimplification.

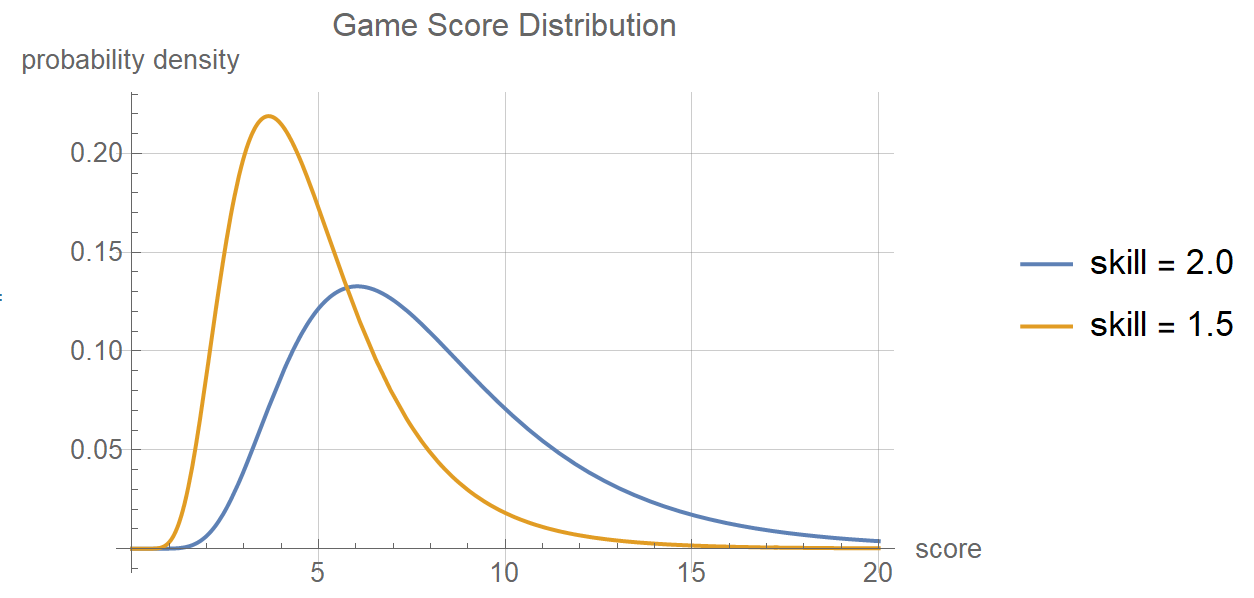
I’m using the same lognormal distributions I’ve used previously for player skill and game score (see post history). Specifically, player skill is distributed according to lognormal(0, 25), and a player’s score on a game is distributed according to lognormal(skill, 0.45). In other words, the scatter parameter on player skill is 0.25, and the scatter parameter on game score is 0.45, with players of higher skill getting higher scores on average. But there is always a chance a lower-skill player wins.

Note about Kendall Tau parameter:

The Kendall Tau parameter measures how well the elements of two vectors match each others’ sorting order. If the vectors are perfectly sorted - that is, if qualifying perfectly sorts players by their intrinsic skill - the Tau parameter equals 1. If the rankings are completely uncorrelated to skill, the Tau parameter will be ~0. And if it sorts them exactly backwards by skill, the Tau parameter will be -1.

Experiment 1:

100 players attempt to qualify, each with randomly determined intrinsic skill. Each players plays one game nPlays times, keeping their best score. After the results are collected, the Kendall Tau parameter is used to evaluate how well the qualifying sorted the players according to their intrinsic skill parameter. This simulated qualifying is repeated 5000 times, to obtain an accurate average for Tau.

nPlays Avg Kendall Tau
1 0.327
2 0.381
3 0.412
4 0.432
6 0.458
8 0.476
12 0.500
16 0.514
24 0.534

We can see a larger number of plays on a game better sorts players by intrinsic skill. However, Tau grows relatively slowly with respect to nPlays, and therefore slowly with respect to the duration of qualifying.

Additionally, it is not clear that a higher value of Tau is better than a lower one. If Tau is 0, the tournament has no sorting power and chaos reigns. But if Tau is 1, the tournament can have no surprises. Presumably, a value in-between 0 and 1 is preferred.

Experiment 2:

Let us consider the number of plays a weaker player would need to have a ~50% chance of out-qualifying a stronger player on a particular game. The stronger player plays the game nA times, while the weaker player plays it nB times. Various combinations of nA and nB are tried to determine how much more effort the weaker player must exert to match the results of the stronger player. The simulation is run 1 million times for each configuration to obtain a good probability estimate.

Stronger player skill = 2.0, representing a top-tier player
Weaker player skill = 1.5, representing a strong player, but a noticeable step down in skill

nA nB Player B win chance (%)
1 1 21.6
2 2 17.0
3 3 14.6
4 4 12.9
5 5 11.9
1 2 33.5
1 3 41.3
1 4 47.0
1 5 51.6
2 13 49.7
3 24 49.8
4 37 49.8
5 52 50.0

If both players play an equal number of games, the weaker player B’s chances dwindle as the number of games increases. A 21.6% chance of out-qualifying player A when they play 1 game each shrinks to a 11.9% chance when they play 5 games each.

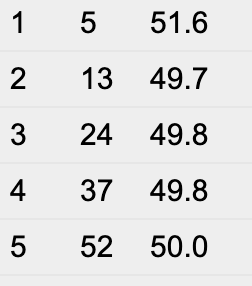
We can see that the amount of work the weaker player B must do to have a 50% chance of out-qualifying the stronger player A increases as player A plays more games. The increase is faster than linear, as a result of the exponential tails of the distributions.

If player A plays 1 game, player B needs an average of ~5 games (about 5 times as many attempts) to reach parity.

However, if player A plays 5 games, player B needs an average of 52 games (more than 10 times as many attempts) to reach parity.

Conclusions:

Surprising absolutely no one, the longer qualifying lasts, the better it is at sorting players by intrinsic skill. The longer qualifying lasts, the lower the probability that weaker players will get lucky and out-qualify stronger players.

2 Likes

This feels like more work for Karl and Andreas without a huge benefit.

How many players does this actually affect ?

Anyone who qualifies with tons of money spent will likely go out in the first round of finals which is where the people who (in theory) are losing out will also go out. So fractions of WPPRs driving to add all this complexity - maybe it being hard to find a name for this was the clue :slight_smile:

Leave this one to the professionals Neil … we got it :wink: