Pinburgh Qualifying Rounds Analysis

Hello Everyone! I’ve put together a very initial cut of visual analysis from Pinburgh by taking a look at the round-by-round scores for each competitor.

https://public.tableau.com/profile/corey.hulse#!/vizhome/Pinburgh2017/ByQualifyingPath

The initial visualization is certainly a busy one, but there are filters that allow you to split data by Division, Name, Finals Status. A lot of the analysis is around the idea of “Plus Minus”, as in how many games above 50% a person is at any given time. In Round 1, +2 would mean you were 7-5. In Round 5, it would mean you were 32-28. There are also filters to look at ranges of scores as of that round.

This is an initial cut with data that I was able to pull together this evening. If there is other analysis that people are interested in, I’m happy to explore further and continue to update this application.

23 Likes

Great work, this is awesome!

Did you take all this data from the pinburgh website?

1 Like

Thank you!

Yes, this was pulled from pinburgh.com. I pulled each of the results pages from each round, did a little bit of Excel work to get the different measures, and threw it into this app. One thing I might try to do this weekend is get seeds for each player for each round. Then, I can re-create the graphs that are on the individual profile pages.

1 Like

Think this proves I only did the 3rd or 4th biggest Choke this year in Pinburgh. Thanks for the app!

3 Likes

This is so cool

1 Like

Now with more charts!

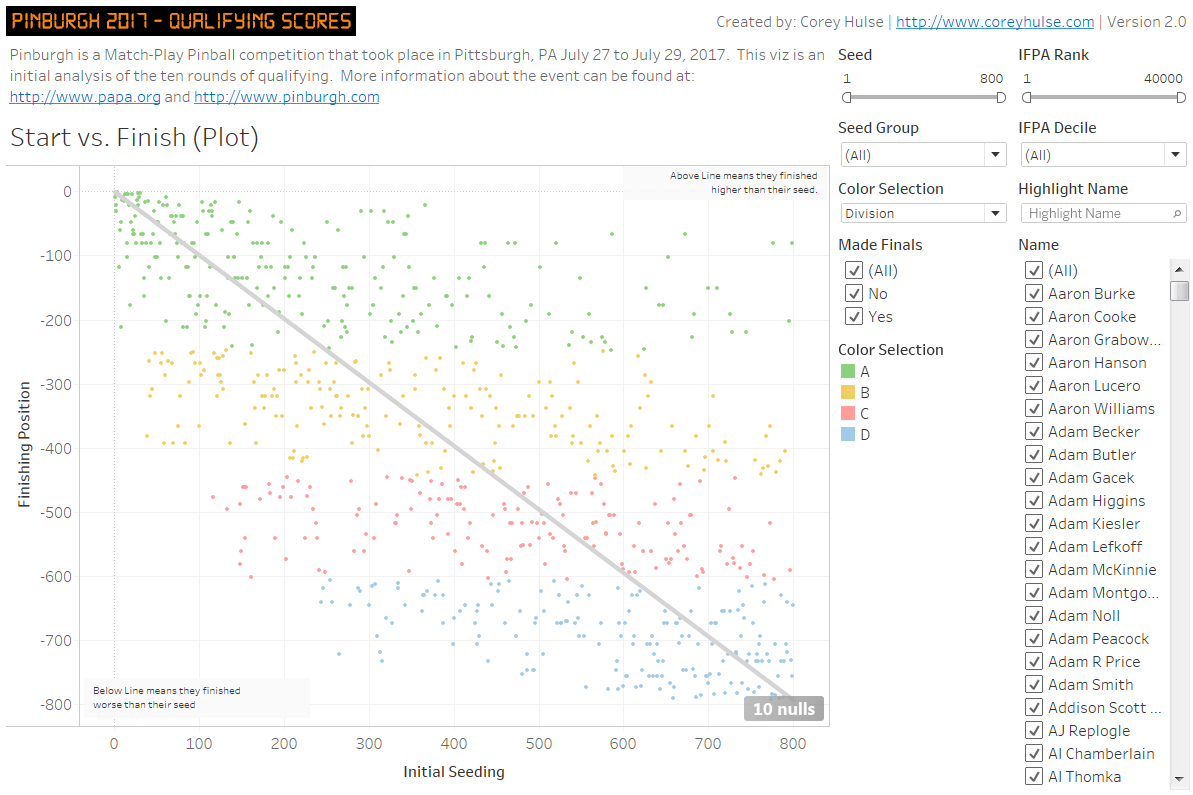
I’ve gotten Initial Seed, Final Qualifying Position, and IFPA Rank all as attributes now, and I’ve added some other filters to help people explore the data:

https://public.tableau.com/profile/corey.hulse#!/vizhome/Pinburgh2017/ByPositionAllRounds

Next will be an individual view of a player, and some additional data clean-up that I didn’t have time to work on tonight.

4 Likes

Mmmmmmm… more charts

Kicking this up again because there was some chatter in another Pinburgh thread about biggest gaps overcome to make A Playoffs.

I’ve cleaned up the Excel sheet that I used as an input for the Tableau model and made it public in case other people wanted to dive into the data. It’s not the cleanest model, but figured it would be better to share the data as-is and let people have at it.

Here’s the link again to the Tableau App (best on Desktops):
https://public.tableau.com/profile/corey.hulse#!/vizhome/Pinburgh2017/ByQualifyingPath

If people have other questions about the data, feel free to ask here! I’ll try to answer what we can based on the data we have.

1 Like

Need to cross post to r/dataisbeautiful.

This is really great stuff.

Edited because my iPhone overcompensates for autocorrect.

2 Likes

One thing that would be great to add is the likelihood of qualifying for a certain division, as a function of round and current points. E.g., if in round 5 with a +2, what are the odds of qualifying for A?

1 Like

Can’t wait!

Woo data! It’s now on my to-do list to gather up data for this year and to build a multi-year dataset. I have some upcoming pinball events and house repairs that will taking up free time so it won’t be an immediate priority, but I have been thinking about a data model so that people can explore the information in a semi-structured way.

7 Likes