Curious to see what the bracket looks like once the winners decide if they’re going or deferring to #2.
First and second were reversed on the WNACS for Alabama. I corrected it. The winner was Deanna Gerard. Holly Hooper was runner up.
Thanks for catching and correcting that!
I’ve added a column with a link to the results for quick and easy verification. I actually added a column to both the NACS and WNACS tabs with that link and then that last tab (“All winners and runners-up”) is now locked and just references the relevant data in the other tabs. So if there are more changes needed, they should be made on the NACS or WNACS tab as applicable.
But actually, now that the dataset is basically complete, I switched the spreadsheet to Comment Only to preserve the data integrity. If anyone wants edit access, just ask! I’ll try to monitor for any corrections needed for the next little while.
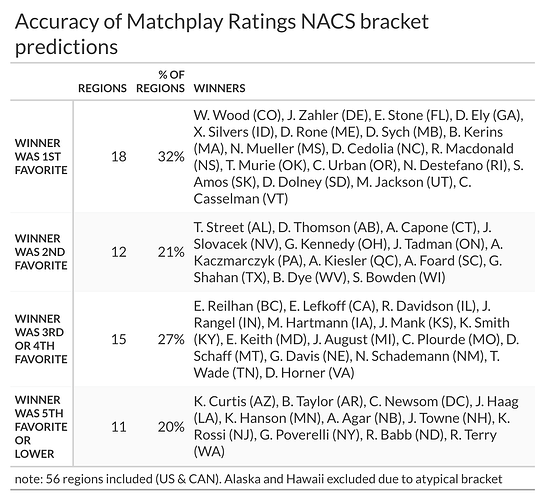
Here is a post-hoc summary of the matchplay NACS predictions. The predicted favorite won in 18 regions (32%), which was a bit lower than 2022 (~44%), and lower than the expected number of correct predictions, given the calculated percentages (22). However, it’s important to note that when the forecast was off, it wasn’t off by much. Approximately ~80% of winners were top 4 favorites of their respective region.
There were some specific comments about the predictions seeming off, let’s revisit those now that we have the final outcome:
In Alabama, the “highly suspect” top two favorites were Scott Mount (38%) & Timothy Street (22%). The final outcome was… 1. Timothy Street 2. Scott Mount. So pretty darn close to accurately representing the real world.
Raymond ended up finishing 3rd, ahead of both Karl and Jim, who finished tied for 9th. The top three predicted favorites in CA (Raymond, Andrew, Escher) finished in the top four – 1. Escher, 2. Nic, 3. Andrei, 4. Raymond. Not perfect, but again, pretty darn close to what actually ended up happening.
While many states shook out in the general predicted direction, there were also many examples of players “beating the odds”. Notably, three states had winners who were given a <1% chance of winning – Bec Taylor (AR), Keith Hanson (MN), Kevin Curtis (AZ).
In sum, there are definitely fair critiques of matchplay ratings – they have some quirks and sometimes have produce questionable numbers. But in aggregate, they do a pretty good job of getting a general sense of how things will go. Maybe not good enough to bet your shirt on, but perfectly adequate for generating some pre-tournament buzz and excitement. At the end of the day, the ball is still wild, and anything can happen.
Better or worse betting results than using IFPA Ratings. Asking for a friend … ![]()
I think it’s worth mentioning that the format change (old/mid/new) introduced more volatility in matches this year than the traditional format of cherry-picking favorite games
Could be! Then again, being only 4 regions off from expected could also be attributed to random chance. E.g., Bowden was the favorite in WI before I reran the model the night before, then he switched to number 2 favorite. Many of the states were a toss up among a handful of players, and those can go any way.
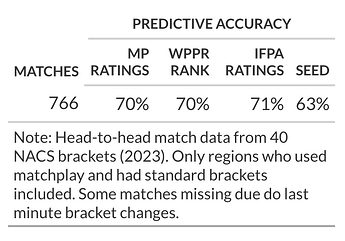
I have not looked at IFPA Ratings, but I did start looking at predictive accuracy of WPPR Rank for individual head-to-head matches. So far, it looks like MP Ratings and WPPR Rank have about the same predictive accuracy (~70%). Something goofy is going on with the data that I need to do more checks on when I have time. I’ll try and add IFPA Ratings, but I know I didn’t pull those in advance of the tournament so unless I can get the rating history, it may be impossible.
How about combining the two, i.e. if BOTH IFPA and MP rate player A above player B, what’s the predictive accuracy then? Do they help each other, hurt each other or doesn’t matter?
nice!
Alright, theres some missing data but I’ve given up trying to figure out why. I know at least some are because there ended up being players in the bracket I wasn’t expecting. Anyway, here are the “final” results, with ifpa ratings included.
Assuming I didn’t mess something up, it’s pretty interesting how similar these metrics performed given how differently they are estimated.
It makes sense that Seed would be the least predictive since it’s partially dependent on how much the person played in the region. The others are all strength-based for the most part.
OK, not Highly Suspect but Slightly Suspect. The real favorite Braden Gentry showed up on crutches and still managed 5th place overall. I was only 56% to make 1/4 finals and 26% to make the semifinals and I finished 3rd. The dead last Jimmy Gable only a 21% chance to make quarter finals finished 6th overall. Brad Allen was 84% to make 1/4 finals and 52% to make semi finals went out in the first round. Chris Harris 79% to make 1/4 finals went out in first round.

