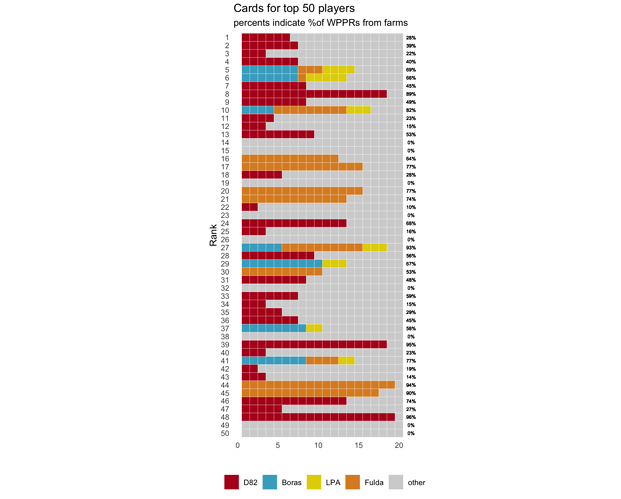
After Fulda is over, it would be interesting to review the top 25 and see what portion of their 20 used results have come from WPPR farms.
Remind me and I’ll rerun the analysis.
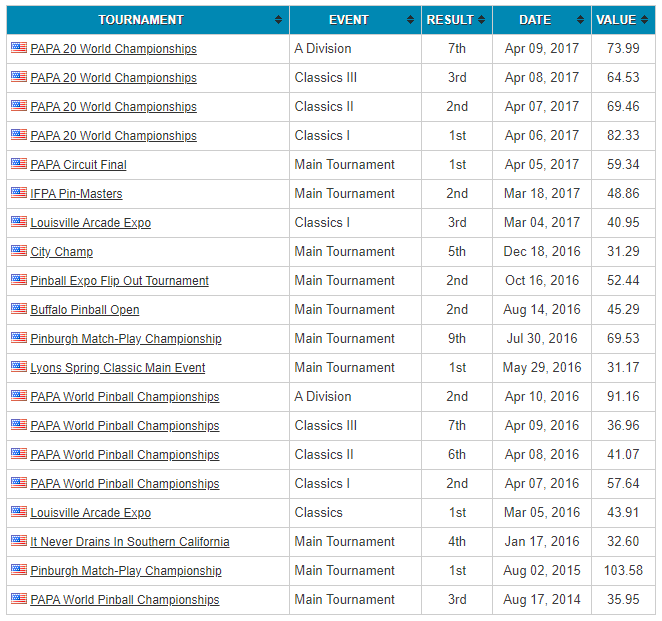
I’ll be curious if anyone has a higher percentage than @Smack847 did from one location on their player card. Zach had 70.6% of his WPPR’s on his active card from the PAPA Farm back in 2017 (12 out of his 20 events). Good thing that PAPA Farm is no longer around to cause such balancing issues ![]()
The current number 8 in the world has 89% of their WPPRs from one location. Several others in the current top 50 beat that 70% benchmark.
The is a way to Nerf WPPR farming without nerfing having multiple events: simply count only a player’s single Best WPPR result per location per year. Players can still play all the events they want anywhere to win money, trophies, whatever. But they’d have to spread themselves around to play different players in different locations on different games (even if many of the same titles at times) to rise to the top, as it should be.
As for PAPA, for all the good it was, it still made the rankings unbalanced. Anyone who couldn’t make it to PAPA for whatever reason was hugely disadvantaged compared to those that could.
Neil Graf is the new Voldemort ![]()
Two things of interest to me . . .
-
How does this look when you actually have players will full cards of 36 months of real activity (so how things looked in March 2020)?
-
How does this look when you factor in the WPPR v5.8 adjustments for Major/Certified/Championship boosts in those resumes?
The big difference here is that the PAPA Farm only had one harvest per year (excluding OG Pinburgh, since it was only two tourneys over a weekend at the PAPA facility, IIRC)
We’ll also need to include results from the Delaware Pinball Collective events now, too. Brand new WPPR farm option for the USA/N. America.
They’re listed as “DPO Event …”
I welcome you to calculate that out and see how it looks.
Pour some out for our D82 homies . . .
Neil Graf → Goes from 8th to 24th
Travis Murie → Goes from 18th to 36th
Tom Graf → Goes from 27th to 52nd
Erik Thoren → Goes from 37th to 64th
Erik Rentmeester → Goes from 55th to 85th
Kassidy Milankowski → Goes from 49th to 86th
Where should these players be ranked?
Neil Graf → Ranked 8th. He really should be ranked “X”.
Travis Murie → Ranked 18th. He really should be ranked “X”.
Tom Graf → Ranked 27th. He really should be ranked “X”.
Erik Thoren → Ranked 37th. He really should be ranked “X”.
Erik Rentmeester → Ranked 55th. He really should be ranked “X”.
Kassidy Milankowski → Ranked 49th. She really should be ranked “X”.
If anyone wants to take a stab at a reasonable estimate for what “X” should be for each of those players, along with a solution that finds a way to put those players in that range of ranking while also making the rest of the rankings look reasonable . . . send any solutions to ifpapinball@gmail.com.
I’ve never been a huge fan of “just do this subjective change” with no backup as to how that impacts what the rankings look like, and if the end result passes the smell test (for years that smell test was - Keith Elwin better be #1).
I’ve been avoiding names and using rankings to avoid singling anyone out. I guess it’s worth clarifying that the point of showing this data is not to shame anyone, but to point out systemic issues. No players or organizers are doing anything wrong-- they are operating totally within the established rules. Keep crushing it Neil, no one thinks you’re evil!
It has always been a conspiracy to keep Peter Watt down.
It will still be highly skewed. The key point is that the portion of the high-WPPR events over the three year period will still be farm-heavy. Pre-shut down, other than PAPA and a bit of Boras, points were spread all over the globe at least somewhat evenly. Yes, some cities had gaps, some had advantages of higher-head count events, but a look at the top 100 WPPR events in any year before 2020 would show most locations with just one or two events. Now, even with 5.8, the farms will likely still have more than half the total good-point events solely due to head count. Anyone care to look at the post-resumption stats to see how many 50 point + events have been farms vs. others?
You might want to explain to everybody what this hypothetical v6.0 attempts to do, and how it does it.
And poor Wolfgang! Mr. Haid drops 117 places!!
What coding do I need to learn to access the data to do a test like that? (And how long does it take to learn it?) (I would have crunched the numbers first if I’d been able to.)
Regardless of which version of WPPR (excluding hypothetical 6.0), the farms will still have a preponderance of good-point events because they have the ability, desire, and local/regional/now-continental player base. When you Play More Pinball, you’re going to give out More Points.
I remember you and I working on previous WPPR changes long ago with just that in mind. ![]()
Rather than tackling individual locations, we tackle the overall problem of imbalance of playing.
Bob’s solution of making someone travel to 20 different locations to fill a card of 20 events just doubles down on the problem of people that travel having an advantage over players that don’t (that’s been a complaint FOREVER).
This WPPR v6.0 solution goes right to the heart of the issue, which is the “IMBALANCE OF OPPORTUNITY OF PLAY”.
The question we ask is whether a player is likely over-ranked because they have participated in an excessive amount of WPPRtunities compared to their peers?
We define excessive participation as anyone in the top 250 that has played beyond the average level of play for those players in the top 250.
Anyone that is defined as a player with excessive participation receives any amount over the average at their Efficiency % rate, rather than the 100% value they receive now.
Two examples from the current v6.0 spreadsheet:
Keith Elwin → His active card is made up 1119.70 WPPR’s worth of activity. The average top 250 player has an active card based on 1222.16 WPPR’s worth of activity. Keith plays less than the average top 250 players, and therefore isn’t considered as someone with an excessive amount of WPPRtunities compared to his peers. He keeps 100% of the 699.70 WPPR’s on his active card.
Neil Graf → His active card is made up 2472.91 WPPR’s worth of activity. The average top 250 player has an active card based on 1222.16 WPPR’s worth of activity. Neil plays more than the average top 250 players, and therefore is considered as someone with an excessive amount of WPPRtunities compared to his peers. His amount of excessive play causes an adjustment to his overall WPPR total on his active card, which was 776.00 WPPR’s. 49.4% of that total (1222.16/2471.91) he keeps at full value, which is 383.51 WPPR’s. The remaining 50.6% of that total he earns at his Eff% value (123.17 WPPR’s). This results in a total active WPPR amount of 506.68 . . . the net result being that he loses 269.32 WPPR’s in his active profile due to his excessive play compared to his peers.
No coding necessary. Everything I’ve looked at has been a manual labor of love. Individually going through player profiles and adjusting for ‘whatever adjustments’ I was playing around with.
Pick enough people to compare/contrast and you can start to get a sense of whether those adjustments have the ability to pass the smell test.
You don’t think this will severely decrease the popularity of these events?
This sounds promising on the surface.

