Pinalytics

I’ve been working on a project called Pinalytics and I’m sharing out Version 1.

https://pinballspinner.com/pinalytics/index.php

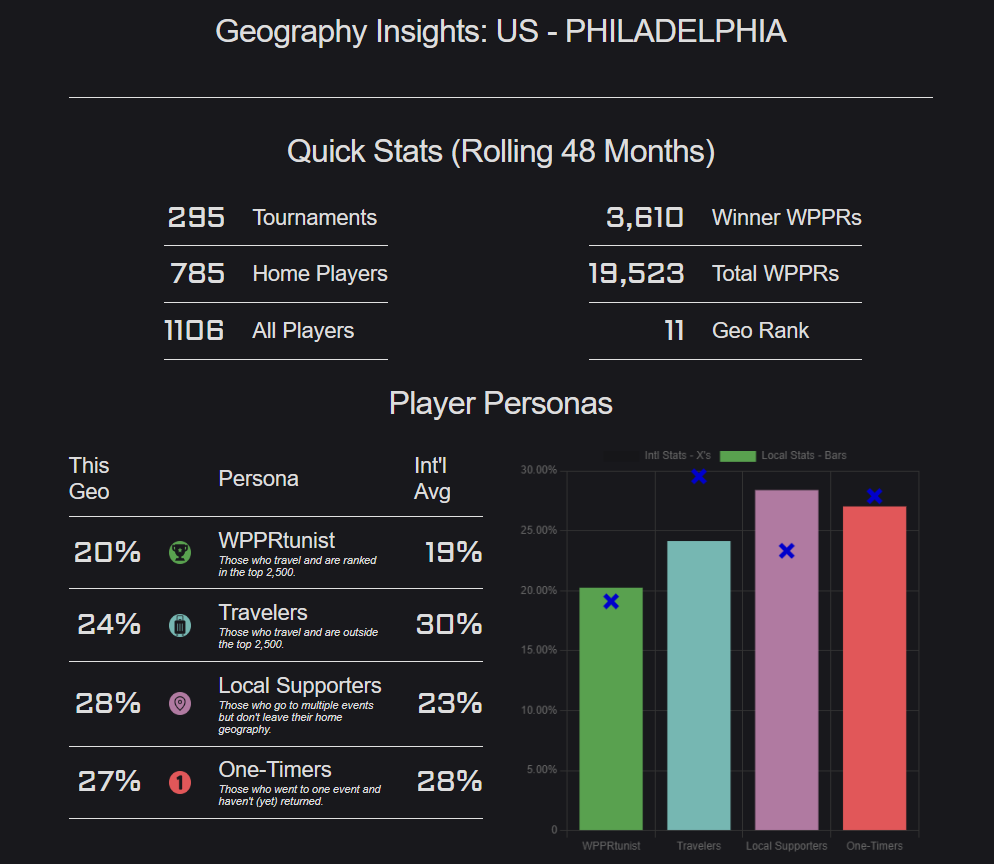
Pinalytics mashes up pinball event and player data from the IFPA with geography information to create a regional profile of pinball stats.

Goals of the project are:

  • Compile Relevant Player and Tournament Data
  • Classify Players and Tournaments into interesting cohorts
  • Add an extra layer to US Geography; instead of just using State lines we tie the ZIP Codes to a Designated Marketing Area centered around urban areas.
  • Capture main metrics for an area for a rolling 48 month basis, which matches the time for which an event value counts towards ranking

@timballs created the Pinball Statistics Power Rankings which focuses on individual player performance which I took inspiration from for this project, but the focus for this project is a macro level for the overall “strength” of a region.

The result is coming up with a regional snapshot like this one for Philadelphia: Pinalytics - US - PHILADELPHIA- PinballSpinner

If you want to read about the metrics used: Pinalytics Metrics – PinballSpinner.com

If you’re interested in the tech stack used: Pinalytics Tech Stack – PinballSpinner.com

It’s to the point where basics are in place across the board to be able to make incremental updates over time. Right now the plan is to keep the data feed flowing the next few months as individual months roll along.

Potential Version 2 enhancements might include:

  • Additional geography breakouts. Right now it’s only broken out for US Metro areas. I tried to find a Canadian breakout but the best I could find was this breakout (List of television stations in North America by media market - Wikipedia) but couldn’t find any connection to Postcode. The concept could be expanded to other areas, but I need other expertise on different regions.
  • Additional metric sets. What are other good metrics for this data set? This is where I’ll presume the pinball community will chime in. Ideas I have are things like engagement scores of players based on how frequently they play, or “customer cohorts” based on how long they’ve been an active player for.
  • Additional dimensionality and attributes. Right now the grouping of things like tournaments have been simple. But there’s more around event formats, Tournament Directors, or event text analysis of event descriptions.
  • Additional datasets. Right now the data is just focused on the some of core items available, but there’s more to potentially do around integrating other sets like data from the MatchPlay.events API or the NeverDrains universe.
  • Finish the API layer. This will make building future graphs easier, but it’ll also open the possibility to share the API out with others so that they can build their own applications or data analysis on top.

If you have any feedback, please drop it in the thread or drop me an email at pinballspinner@gmail.com.

15 Likes

This is really great work, Corey! A ton of work went into this and it shows. I really enjoyed viewing my regions data and see how we stacked up against the rest of the world. Great idea on using the “Designated Marketing Area”. I’ve run into this issue before when looking at Houston data, because so many of the Houston events occur in surrounding suburbs rather than Houston proper.

As far as new metrics, an idea I’ve had for a while but have no reason to act on would be some kind of “impact factor” to measure the importance of an event or region. Basically, what would happen to the rankings if an event/region just got snapped into oblivion? Would it result in dramatic changes to the top 100, or none at all? Something like this would give a sense of “where the action is happening” in the pinball world. There’s a number of ways to approach this, a simply way would be for each event, count the number of cards the event appears on for the top 100. So the max score for each event is 100. You could aggregate that up to the regional level, divide by number of possible spots, etc.

Again, great work! Can’t wait to see what else you add.

Is US-KY right? All those people haven’t competed in KY in some time. Seems like that list is frozen in time from like 8-9 years ago. Very cool idea!

Yeah seems like all the US - [state abbreviation] ones are broken. Outside of that this is awesome @coreyhulse

I’d suggest combining Palm Springs with LA if possible, would be more meaningful, since all the Palm Springs region stats are based on past events at the former Museum of Pinball. Palm Springs is a pinball dead zone otherwise.

I will take a look at the States in the dropdown list and make a correction in the next iteration. The idea is instead of just using State lines we tie the ZIP Codes to a Designated Marketing Area centered around urban areas. The things coming up as States must be older events or events without ZIP Codes.

So the definitions that I am using are Nielsen DMAs.

Perhaps in the next iteration I can introduce some kind of rate change to highlight recency vs. older events.

Came here to say this, but someone had already said it. Thanks @jay

1 Like

OK, the dropdown has been cleaned up to remove the US States from the dropdown. Now it’s just Cities.

There’s two exceptions:

Proud to be the top local supporter in the Chicago area! I’m finally #1 at something if you slice the data enough; my new favorite website.

Revitalizing an old thread with a few updates.

I’ve released version 2.0.0 which introduces some updated elements.

https://pinballspinner.com/pinalytics/index.php

  • Weekly updates - Data will be extracted on Fridays and the website will be updated on Sunday evenings
  • Manual tech stack has been replaced by automated python scripts, AWS RDS processing, and dbt Cloud for analytics processing

The goal of 2.0.0 was to update the tech stack and make sure all the automated bells and whistles are working as expected. Next Monday (Aug 6) we should start to see July tournaments included in the mix.

Looking ahead to 3.0.0 (target October), the goals include:

  • Change the “time window” from 48 months to 36 months to focus on the same amount of time that IFPA points are active before they decay
  • Introduce a player profile page
  • Introduce maps
  • Time-comparisons & KPIs → How does this area compare to last month? Last year?
  • Time-series bar charts showing the growth (and decay) of specific regions over time
  • Tweaks to the “personas” definitions

If you have any other ideas you want to throw out there, please leave a comment or drop me a note!